
System Design Essentials: How Distributed Tracing Works
Learn the fundamentals of distributed tracing. This blog will explain how requests are tracked across microservices using Trace IDs and Spans.

Software architecture has undergone a fundamental shift over the last decade.
The industry has moved away from building applications as single, monolithic units and toward building systems composed of many small, independent services. This architectural style is known as microservices.
While this transition offers significant benefits for scalability and deployment speed, it introduces a critical challenge regarding system visibility.
When a software system runs on a single server, understanding its behavior is relatively straightforward.
Developers can rely on shared memory and sequential log files to determine why an error occurred. However, when a system is distributed across hundreds of servers and networks, this linear visibility disappears.
A single action by a user can trigger a complex chain of events involving dozens of distinct services.
If a failure occurs deep within this chain, identifying the root cause becomes a difficult task.
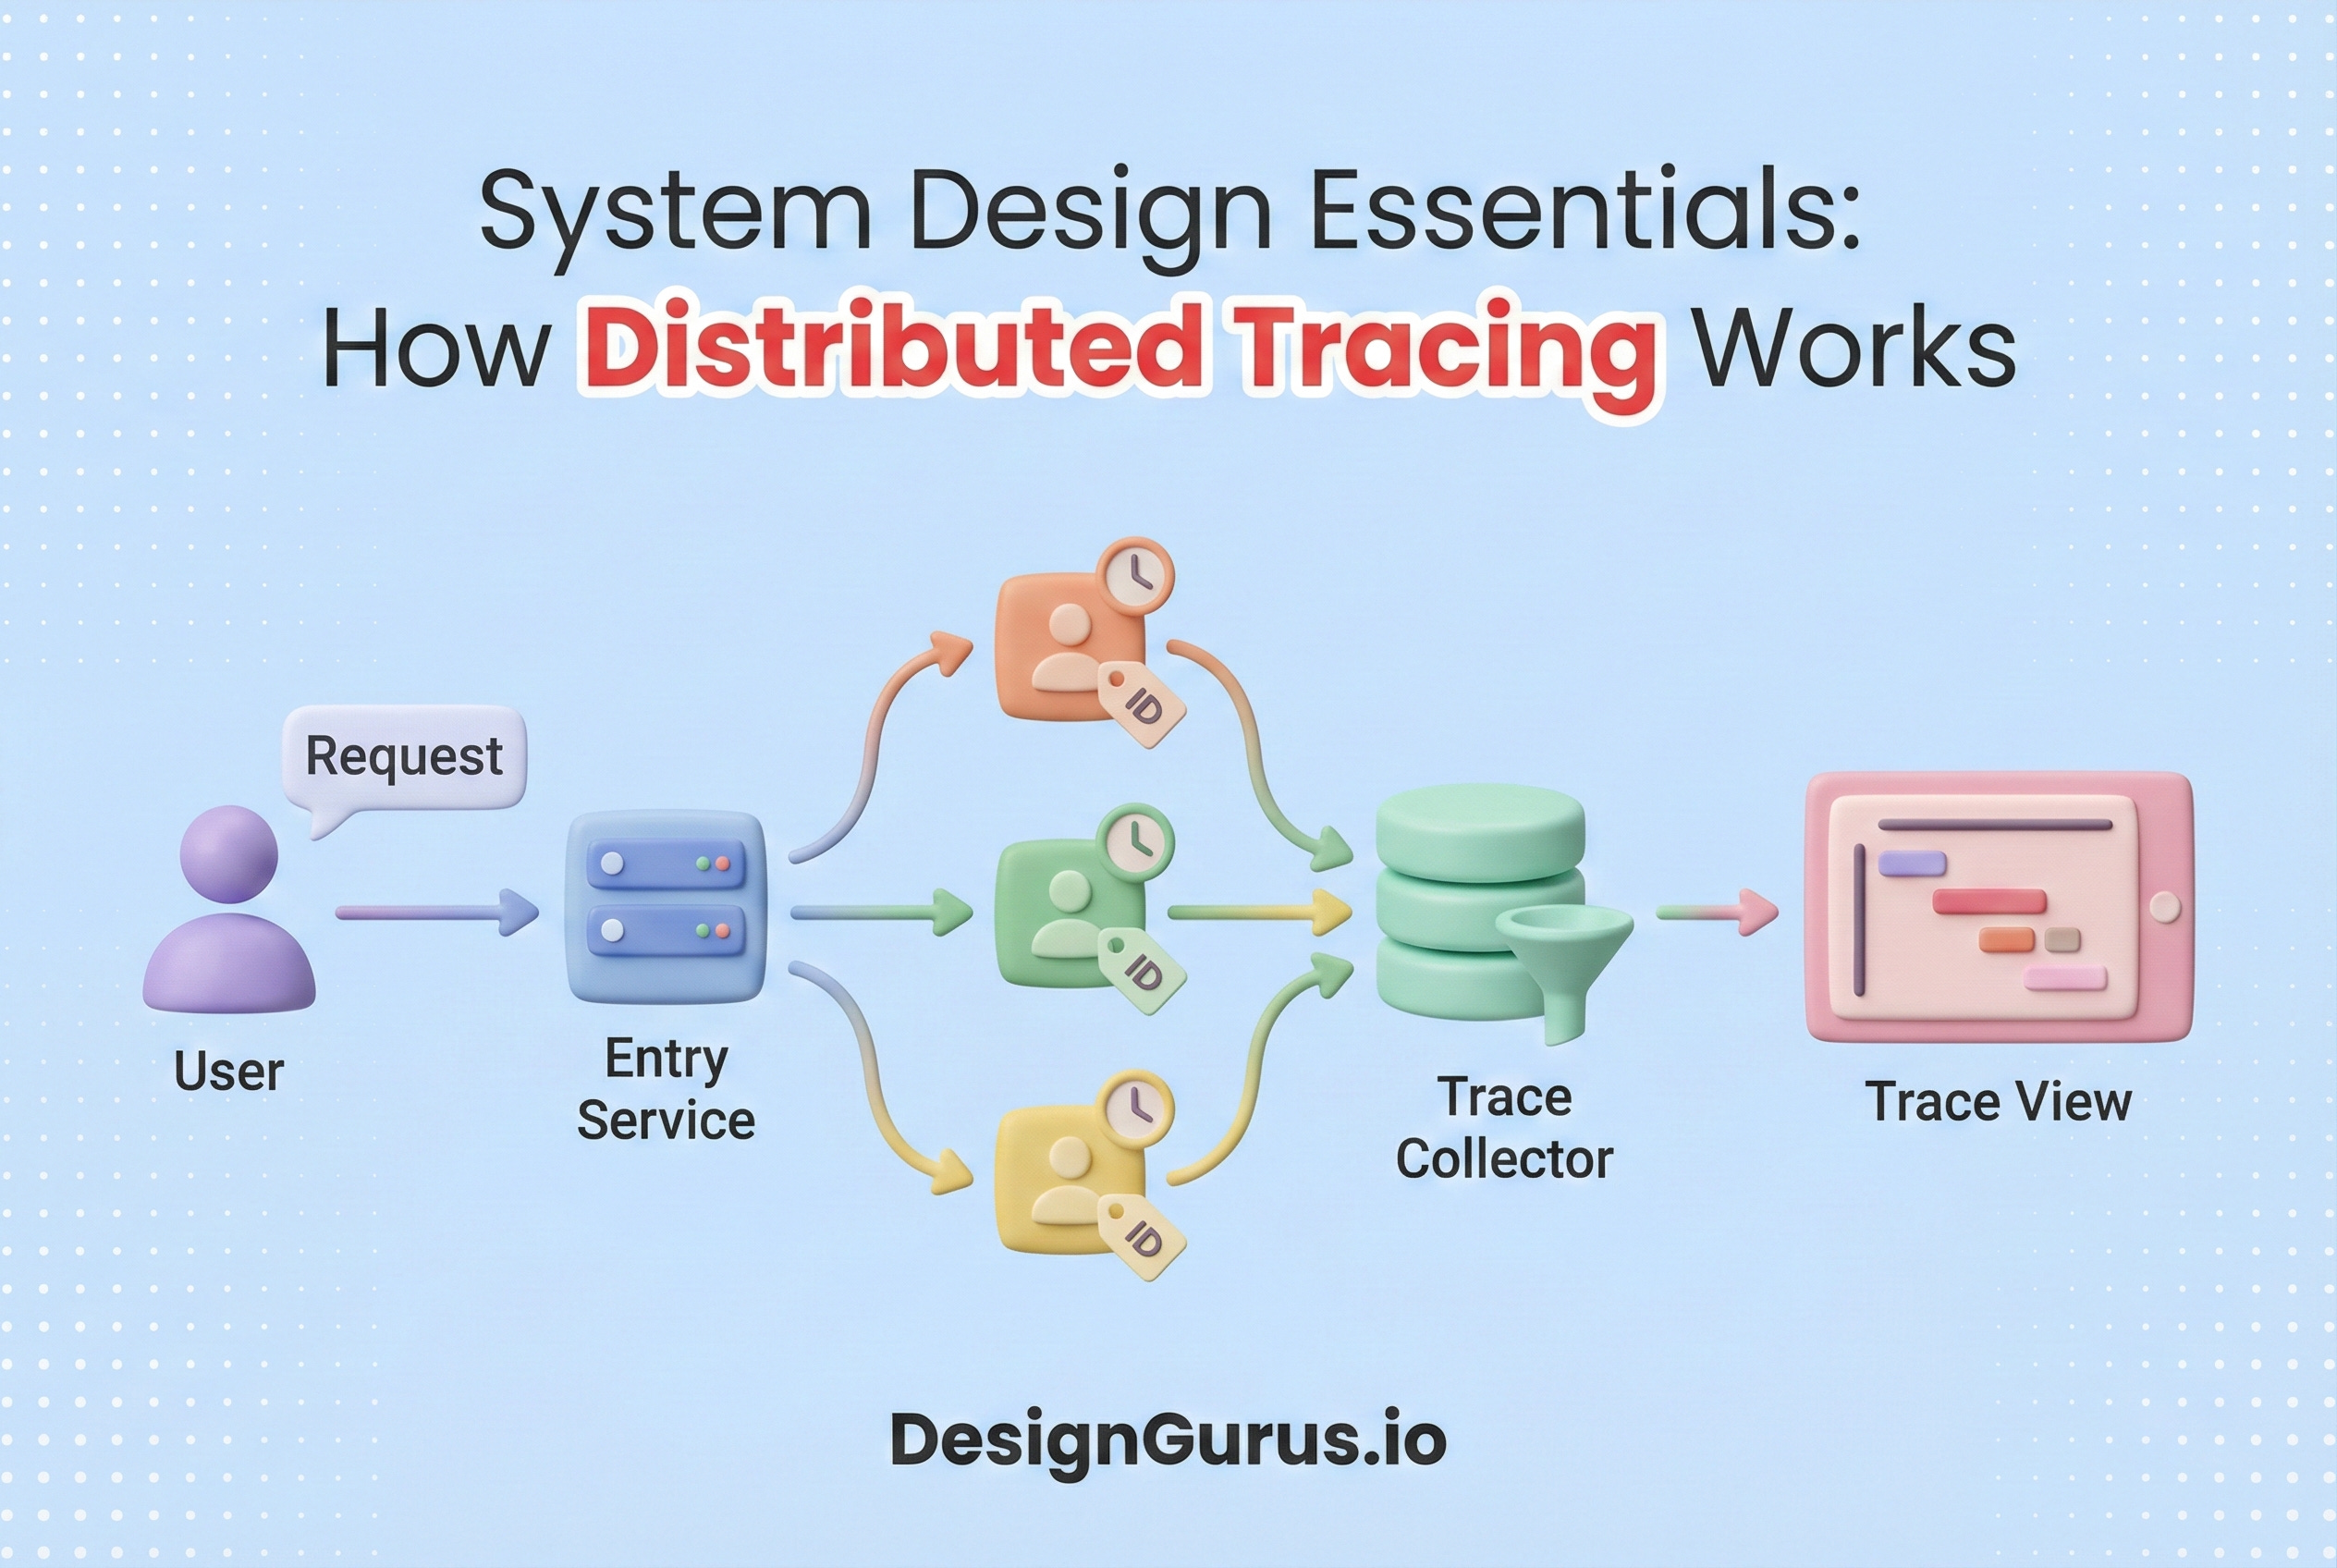
Distributed tracing is the technology designed to solve this specific problem. It provides a mechanism to track the progression of a single request as it propagates through a complex, distributed environment.
This guide explores the technical mechanics of distributed tracing. It explains how the technology works, the terminology it uses, and why it is an essential concept for modern system design.
The Visibility Problem in Microservices
To understand the necessity of distributed tracing, one must first understand the limitations of traditional monitoring tools in a distributed architecture.
In a monolithic application, all functional components reside within the same process.
When a program executes, it generates logs that are written to a single file. These logs are naturally sequential.
If an error occurs, a developer can read the log file from top to bottom to reconstruct the sequence of events leading to the failure.
In a microservices architecture, the application logic is split across network boundaries.
A single user request, such as loading a profile page, might require communication between a frontend service, an authentication service, a database service, and a recommendation engine. Each of these services runs on a different server or container.
Consequently, each service writes its own independent log file.
This separation creates disjointed data.
If the recommendation engine fails, it records an error in its local log.
However, the frontend service that initiated the request only knows that the backend failed; it does not know why.
A developer investigating the issue sees a generic error on the frontend and a specific error on the backend, but there is no shared identifier to link these two events.
The developer cannot easily determine which frontend request caused the backend error.
Distributed tracing bridges this gap by creating a connective layer of metadata that binds these isolated events into a coherent narrative.
Core Concepts and Terminology
Distributed tracing relies on a specific set of concepts to model the lifecycle of a request.
Understanding this vocabulary is necessary for anyone preparing for system design interviews or working with observability tools.
The Trace
A Trace represents the complete journey of a request through the distributed system. It is the top-level container for all the data associated with a specific transaction.
The lifecycle of a trace begins when a request enters the system, typically at a load balancer or API gateway, and ends when the final response is returned to the client. The trace serves as the unit of consistency.
All operations that occur as a result of that initial request belong to the same trace.
The Span
A Span is the fundamental building block of a trace. It represents a single operation or unit of work.
A trace is essentially a collection of spans organized in a hierarchical structure.
For example, if a service receives an HTTP request, processes it, and queries a database, the entire duration of that processing is a span.
The database query itself is a separate, smaller span nested within the first one.
Every span contains specific attributes that describe the operation:
Operation Name: A human-readable label, such as
GET /api/userorSQL SELECT.Start and End Timestamp: These precise time markers allow the system to calculate the latency (duration) of the operation.
Tags and Attributes: Key-value pairs that provide context. These might include the HTTP status code (200, 404, 500), the database host address, or the specific error message if the operation failed.
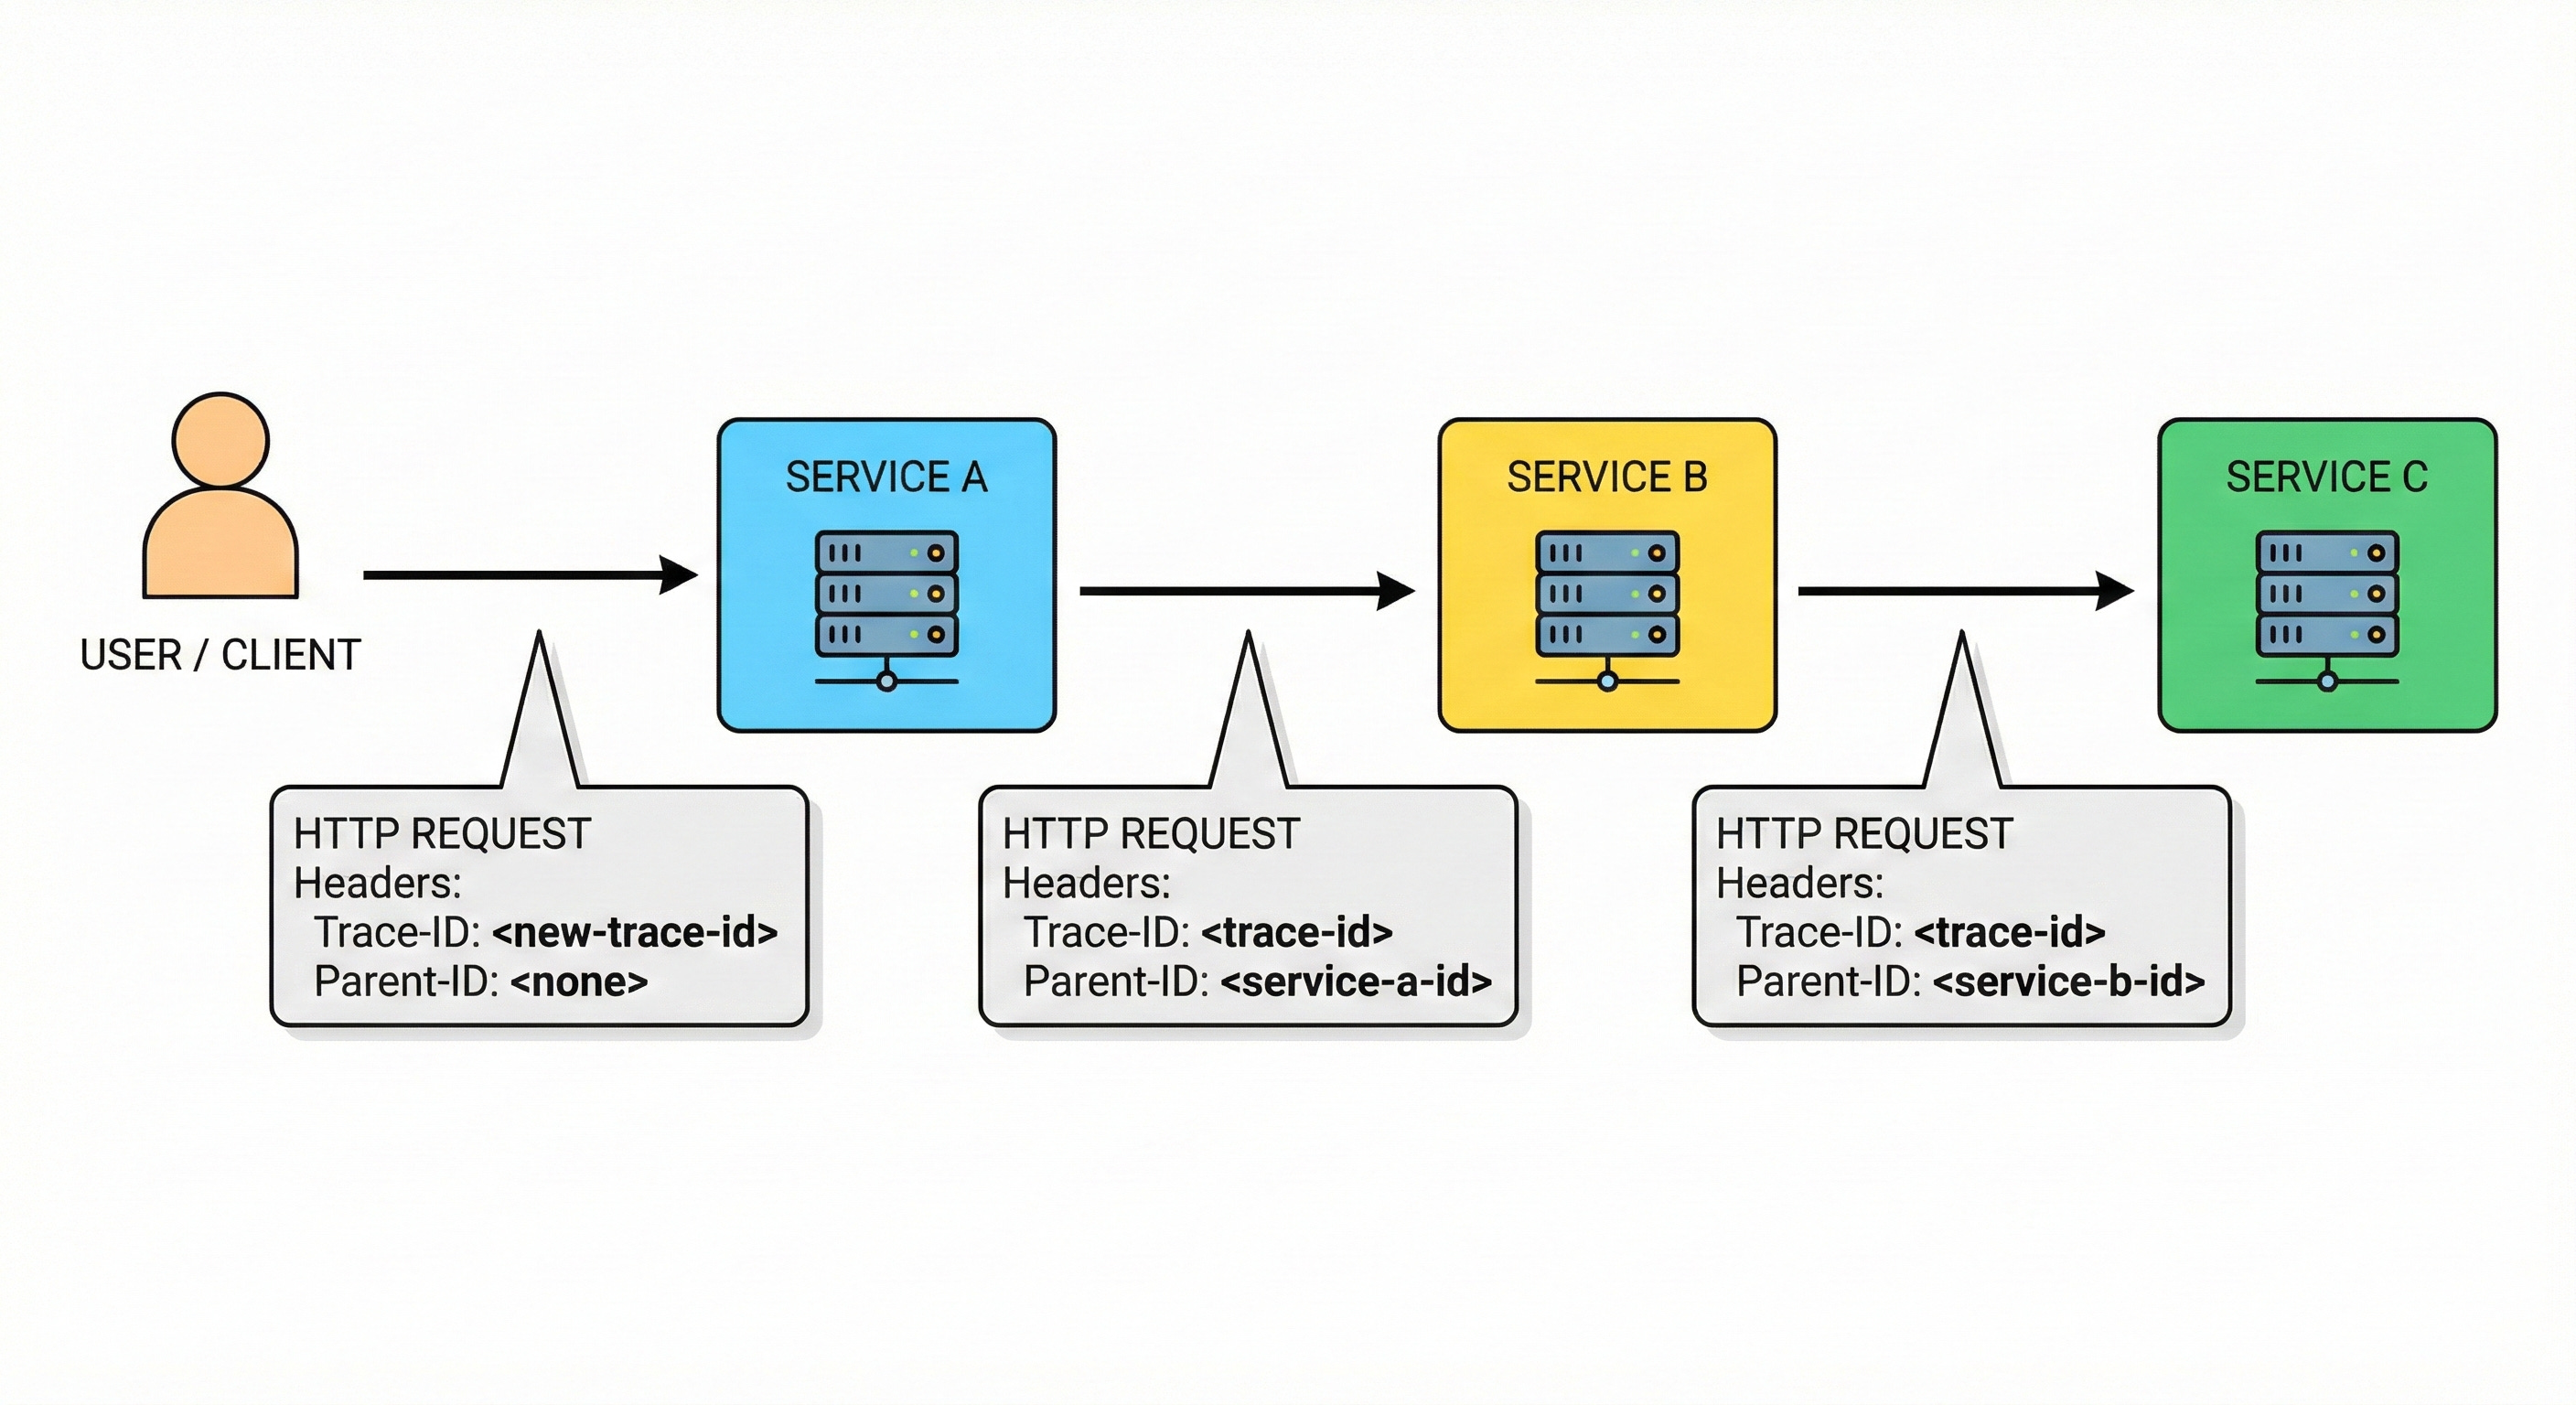
Span Context: This includes the identifiers required to link the span to the trace.
Keep reading with a 7-day free trial
Subscribe to System Design Nuggets to keep reading this post and get 7 days of free access to the full post archives.