
Stop Saying “We’ll Shard It”: The System Design Interview Guide to Sharding
Twelve Diagrams That Cover Every Sharding Concept From Basic Partitioning to Consistent Hashing, Hot Key Mitigation, and Real-World Sharding Patterns Used at Scale


What This Blog Will Cover
Why sharding is hard to get right
Hash and range sharding diagrams
Consistent hashing in depth
Hot keys and rebalancing
Real system sharding patterns
In a system design interview, the moment a candidate says the database is getting too large, the solution almost always arrives within seconds. We can shard it.
The interviewer nods and asks the next question.
How would you shard it?
What key would you use?
What happens when one shard gets too much traffic?
What happens when you add a new shard?
What do you do about users with millions of followers?
At this point, candidates who said shard it as a reflex begin to struggle. They meant add more database nodes to handle more data and more writes, which is correct. But they do not have a clear picture of how sharding actually works at the mechanism level, which means they cannot answer the follow-up questions that reveal whether the design would actually hold together.
Sharding is one of the most commonly proposed and most poorly understood techniques in system design. It sounds straightforward: split the data across multiple machines.
In practice, every sharding decision has cascading consequences for query patterns, operational complexity, failure behavior, and the handling of data that does not distribute evenly. Getting sharding right requires understanding the mechanisms in enough detail to reason about each of these consequences.
Twelve diagrams cover every sharding concept that matters, from the basic partitioning approaches through consistent hashing, hot key problems, rebalancing strategies, and the patterns used by real systems at scale.
Read them in sequence to build the complete picture. Return to specific diagrams when you need to reason through a specific aspect.
Diagram 1: Why a Single Database Breaks
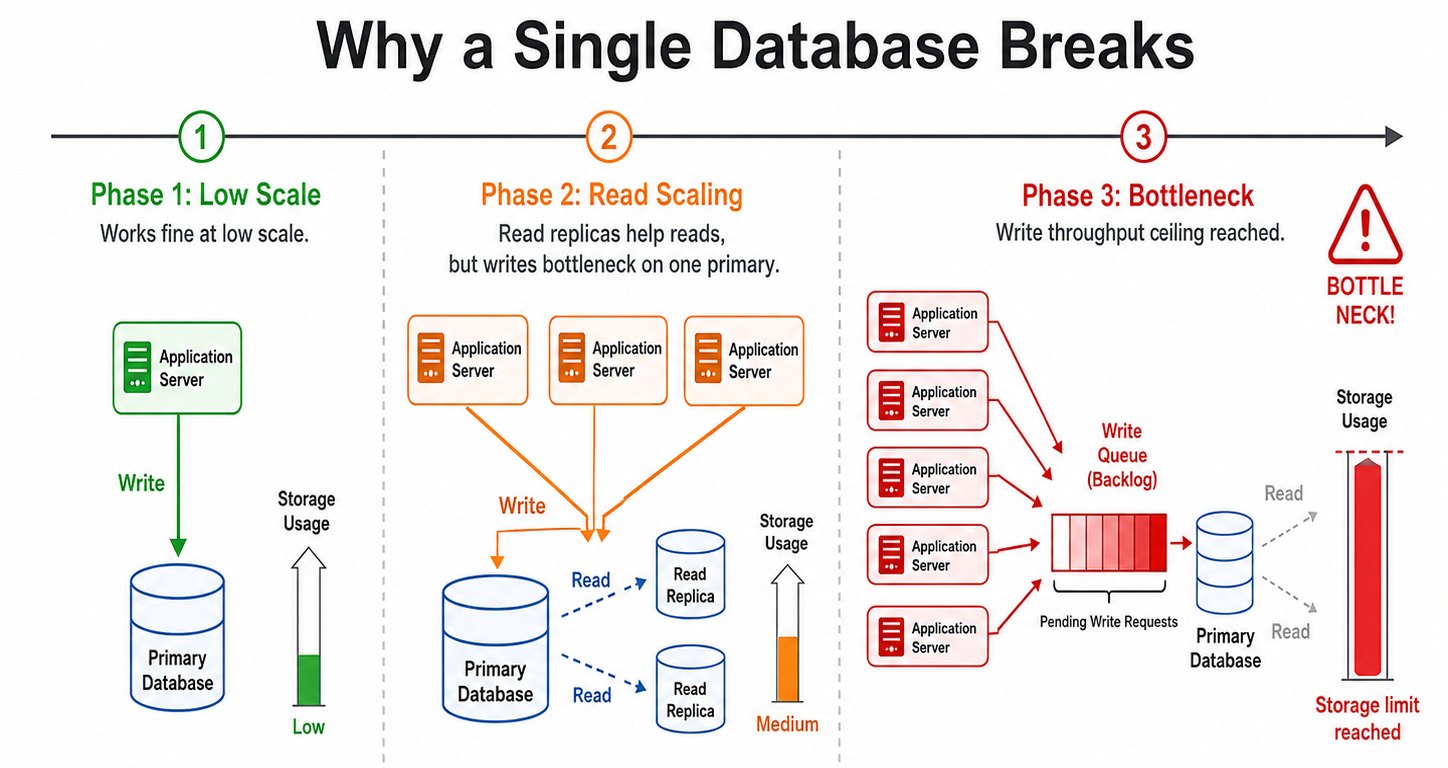
What it shows: The point at which a single database becomes the bottleneck and sharding becomes necessary.
What to draw: Draw a timeline with three phases.
Phase 1: one application server connected to one database, labeled works fine at low scale.
Phase 2: multiple application servers all connected to the same database, the database handling reads well with read replicas but all writes still funneling through a single primary, labeled read replicas help reads but writes bottleneck on one machine.
Phase 3: write volume exceeding what one machine can absorb, showing a queue of pending writes building up behind the single primary, labeled write throughput ceiling reached. Draw vertical arrows showing storage capacity also being exhausted as data grows. Label the two distinct problems that sharding solves: write throughput and storage capacity.
This diagram establishes the exact motivation for sharding.
Replication scales reads. It does not scale writes or storage.
Sharding is specifically the solution to those two problems.
What the interviewer scores: Whether you distinguish between why you would add read replicas versus why you would shard. Candidates who reach for sharding before exhausting replication are over-engineering. Candidates who add replicas when they have a write bottleneck are not solving the problem.
Trade-off: Sharding adds significant complexity. It should only be introduced when write throughput or storage genuinely exceeds what a single well-configured machine with replicas can handle.
Diagram 2: Range-Based Sharding
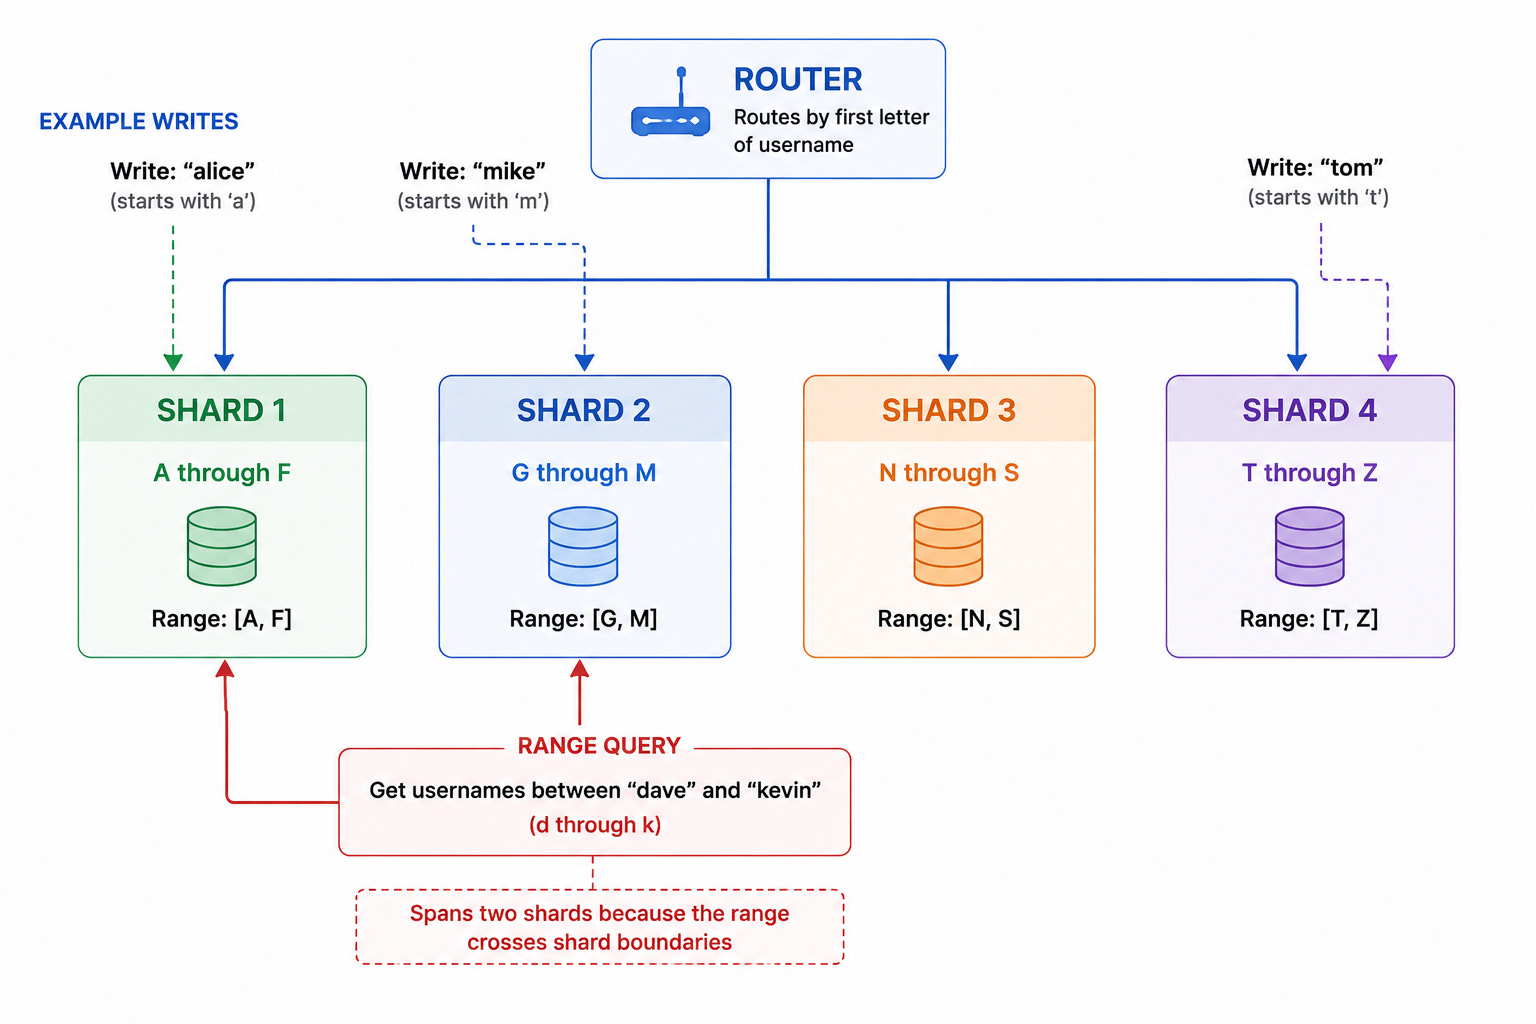
What it shows: How data is partitioned by value ranges of the shard key.
What to draw: Draw four shards arranged horizontally labeled Shard 1 (A through F), Shard 2 (G through M), Shard 3 (N through S), Shard 4 (T through Z) for a username shard key. Draw a router above them receiving queries and directing each to the correct shard based on the first letter of the username. Draw example writes: alice going to Shard 1, mike going to Shard 2, tom going to Shard 4. Show a range query for all usernames between dave and kevin spanning Shard 1 and Shard 2 with arrows to both.
Range sharding enables efficient range queries because related data lives on the same or adjacent shards. It is the natural choice when queries frequently ask for data within a contiguous range.
What the interviewer scores: Whether you immediately identify the hot shard problem in range sharding and whether you name the specific scenario that causes it.
Trade-off: Range sharding creates hot shards when the access pattern is not uniform across the range. For username sharding, users whose names start with common letters generate far more traffic than those starting with rare letters. For time-based sharding, the current time range always receives all writes while historical ranges receive only reads.
Diagram 3: Hash-Based Sharding
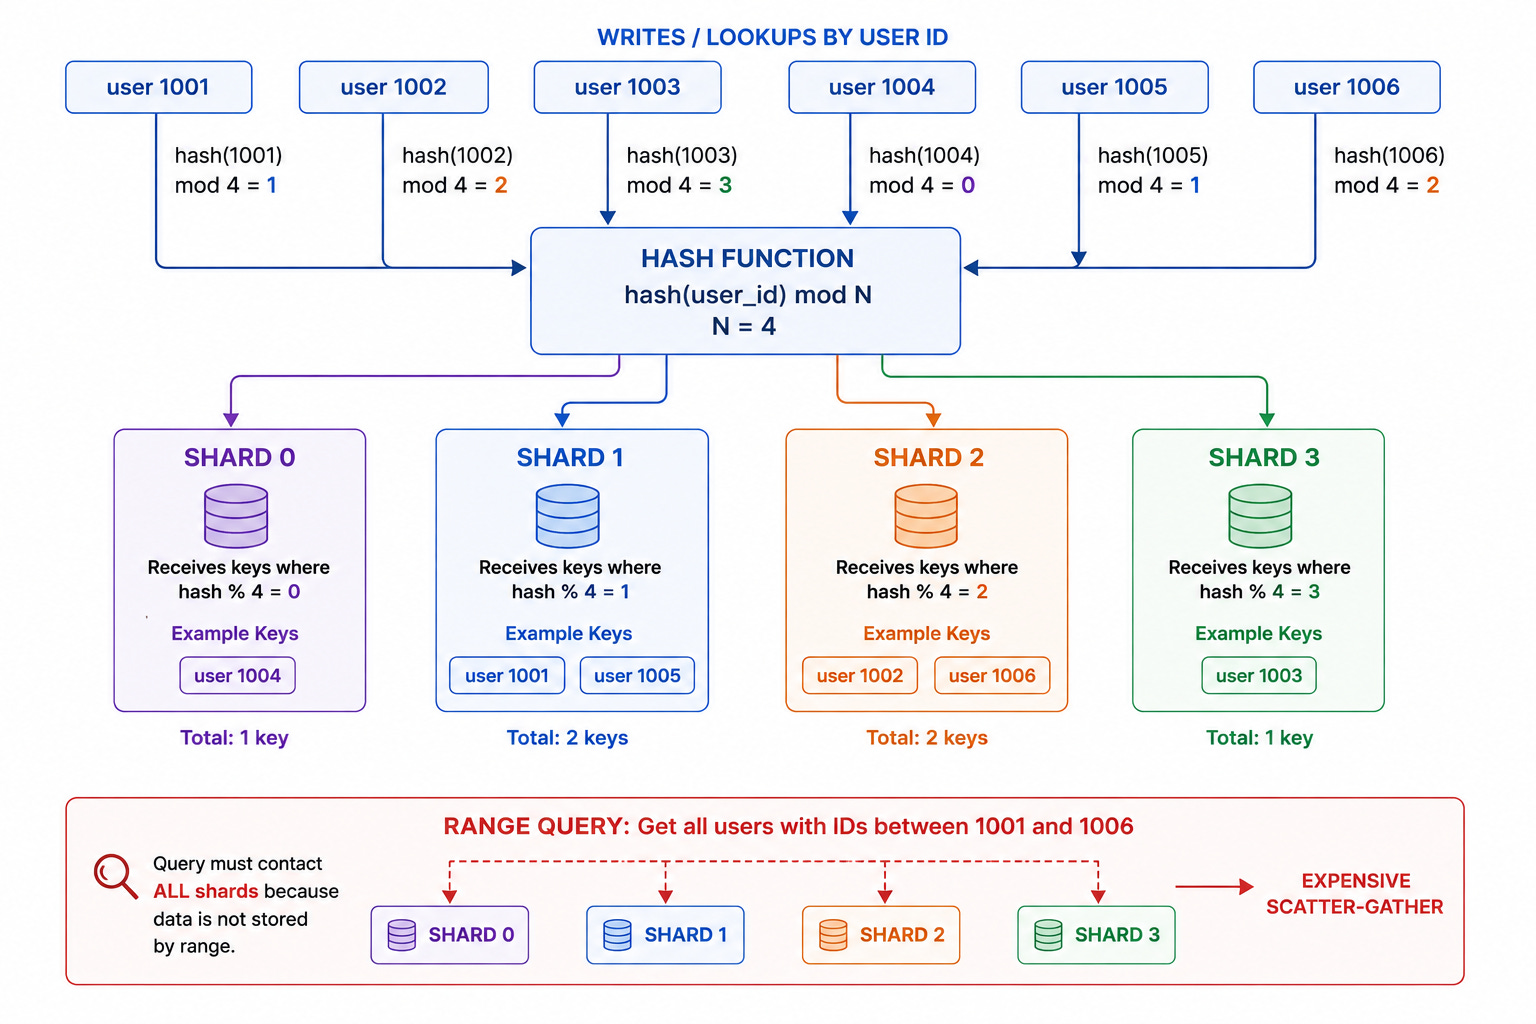
What it shows: How a hash function distributes data evenly across shards by converting the shard key to a shard index.
What to draw: Draw a hash function in the center labeled hash(user_id) mod N where N equals four.
Draw four shards below labeled Shard 0, Shard 1, Shard 2, Shard 3.
Draw six user IDs entering the hash function: user 1001 hashes to 1 going to Shard 1, user 1002 hashes to 2 going to Shard 2, user 1003 hashes to 3 going to Shard 3, user 1004 hashes to 0 going to Shard 0, user 1005 hashes to 1 going to Shard 1, user 1006 hashes to 2 going to Shard 2.
Show even distribution across shards.
Show a range query for all users with IDs between 1001 and 1006 requiring all four shards to be contacted, labeled expensive scatter-gather.
Hash sharding solves the hot shard problem of range sharding by distributing data uniformly. The cost is the loss of range query locality.
What the interviewer scores: Whether you name the range query problem immediately and whether you explain why it matters for the specific system being designed.
Trade-off: Hash sharding distributes writes and storage evenly but destroys the locality that makes range queries efficient. For user-centric lookups by ID, this is fine. For time-series data where range queries by time are the primary access pattern, hash sharding is the wrong choice.
Diagram 4: The Naive Modulo Problem
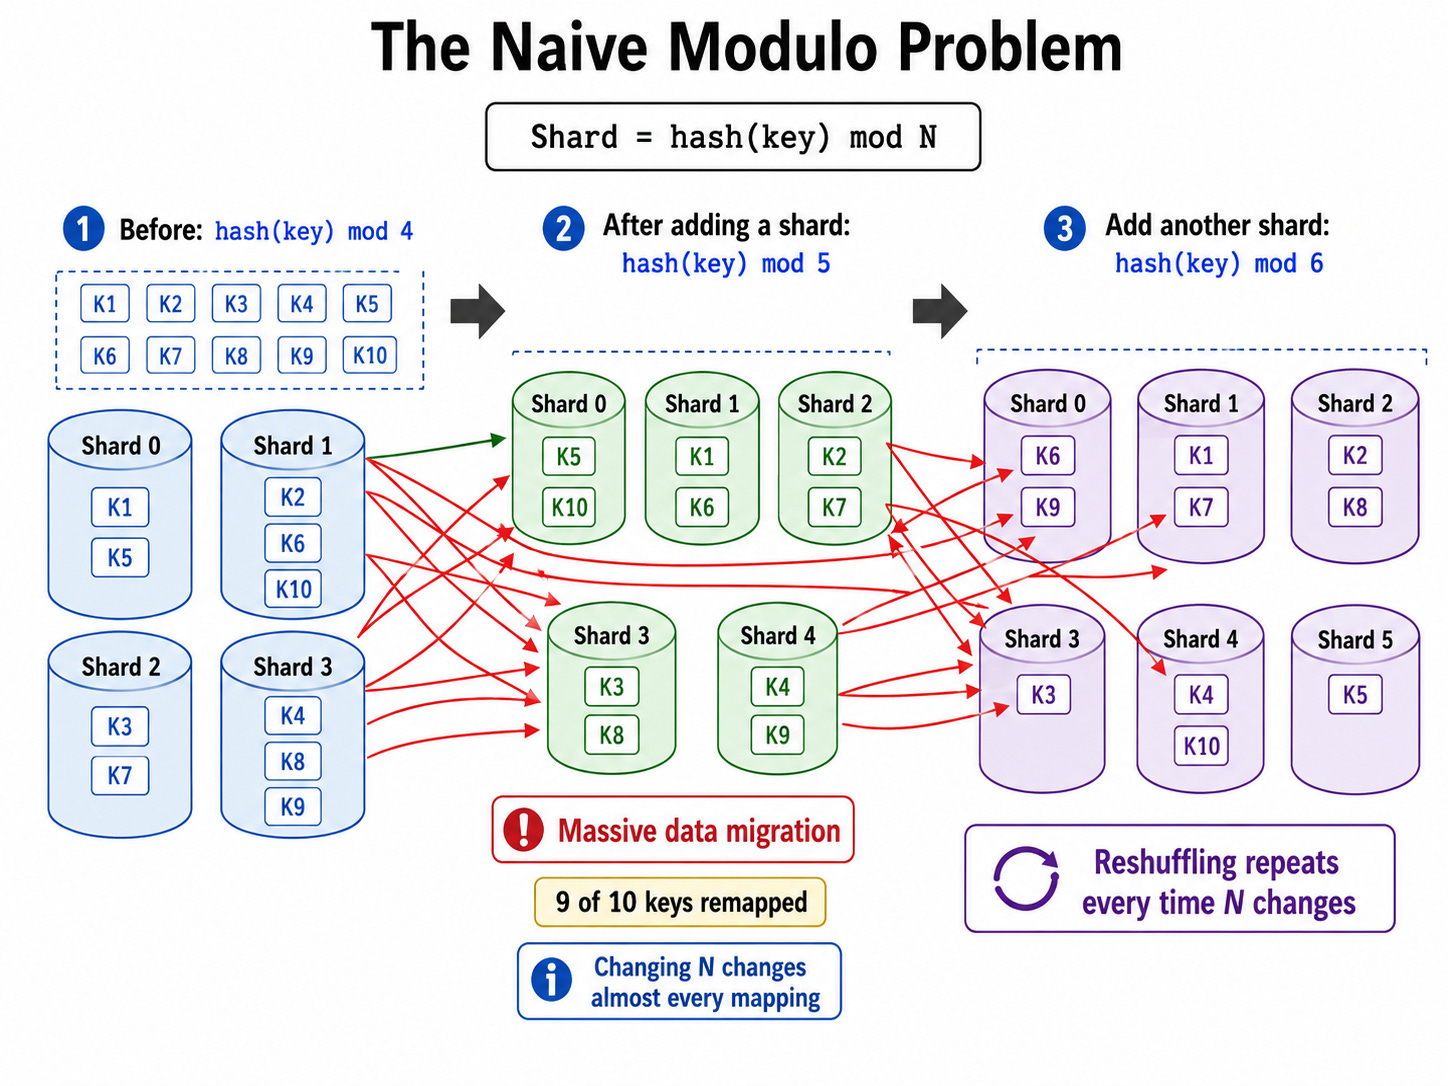
What it shows: Why hash(key) mod N breaks catastrophically when N changes, and why this makes it unsuitable for dynamic sharding.
What to draw: Draw a four-shard cluster using hash(key) mod 4. Show ten keys distributed across the four shards, two or three per shard.
Draw a new fifth shard being added, changing the formula to hash(key) mod 5.
Draw the same ten keys being rehashed and show nine of the ten mapping to different shards than before.
Draw arrows showing the data that must move, nearly all of it, to the new correct shards. Label this massive data migration. Then draw a six-shard cluster showing the problem repeating each time a shard is added.
The naive modulo approach requires reshuffling nearly all data whenever the cluster size changes. At scale, this data migration is enormously expensive and requires the cluster to be partially unavailable during the migration.
What the interviewer scores: Whether you identify this problem before being asked about it and whether you immediately connect it to consistent hashing as the solution.
Trade-off: Naive modulo sharding is simple to implement but operationally dangerous in any cluster where the number of shards might change. The migration cost makes scaling painful enough that teams avoid it, which means the cluster is under-sized when traffic grows.
Diagram 5: Consistent Hashing Ring
What it shows: How consistent hashing distributes data across nodes while minimizing data movement when nodes are added or removed.