
Observability in Microservices: A Beginner’s Guide to Logs, Metrics, and Traces
Observability isn’t an afterthought! Learn how logging, metrics, and tracing form the backbone of microservice monitoring. Tips on implementing these pillars early to prevent downtime.

This post breaks down the basics of the three pillars of observability—logging, metrics, and tracing—and explains why you should build these capabilities into your microservices from day one.
Imagine it’s 3 AM and an alert wakes you because a critical microservice is failing.
Bleary-eyed, you scramble to figure out what went wrong.
Without good logs, metrics, or traces, you’re basically guessing in the dark.
Not fun, right?
Microservices are like a complex puzzle—if one piece breaks, finding the issue without a map is painful.
That’s where observability comes in.
Observability is about designing systems to produce the right data (logs, metrics, traces) so you can understand what’s happening inside from the outside.
In other words, it’s a strategy to ensure your services constantly tell you when something’s off, where it’s off, and why.
Now, observability isn’t just a fancy word for monitoring.
In a microservices architecture with dozens or even hundreds of moving parts, traditional monitoring falls short of pinpointing problems.
With greater scale and complexity comes a greater need for observability – there are many potential points of failure in a distributed system that must be addressed by building observability into the design.
Observability lets developers explore issues across those many components and understand what’s really happening in production, helping to prevent downtime and optimize performance.
In short, observability gives you the visibility and control to identify and fix issues quickly, even in a complex microservice maze.
So what are the core pieces of observability?
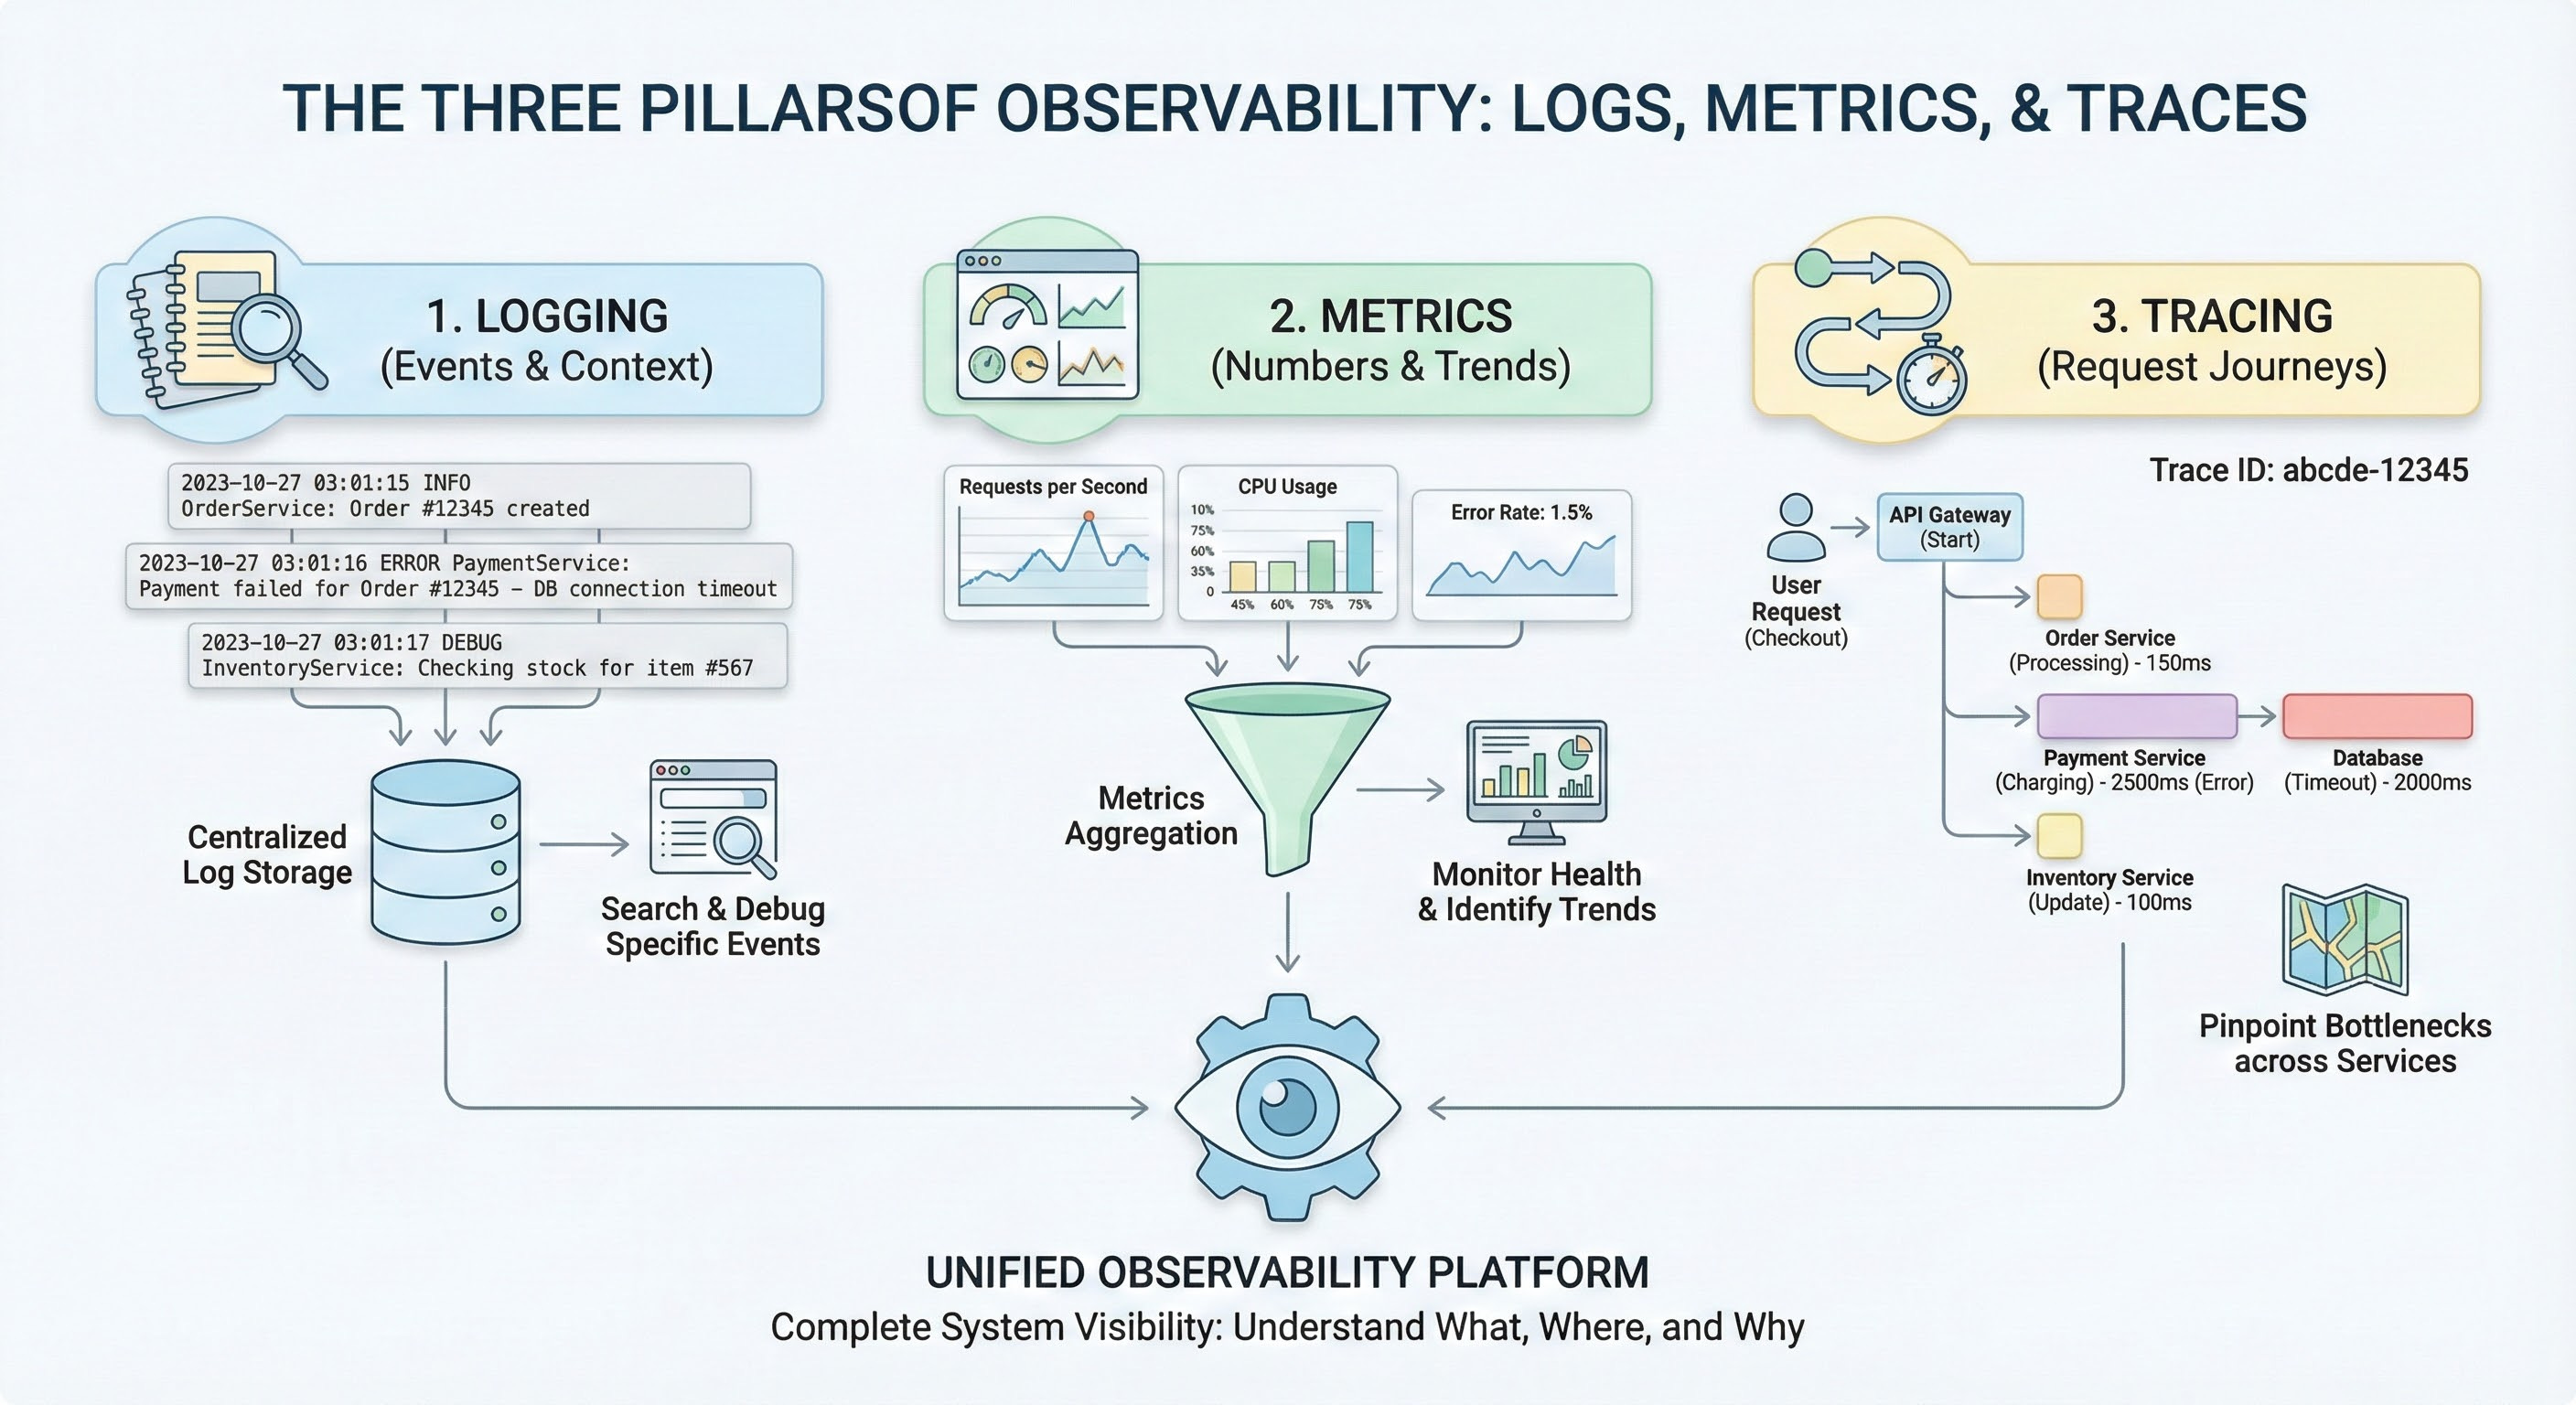
They’re often called the “three pillars” of observability: logs, metrics, and traces.
Each pillar provides a different perspective on your system’s health and performance, and together they give you a complete picture.
Let’s break them down one by one in plain English.
Logging (Pillar 1: Events and Context)
Logs are the text records of events that happen in your system.
Think of logs as a diary of what each service is doing.
Every time something noteworthy occurs—an error, a user action, a database query - your code can write a log entry describing what happened and when.
A log usually includes a timestamp, a message (like “Payment service – error connecting to database”), and possibly details like request IDs or user IDs.
Logs can be plaintext, structured (e.g., JSON), or binary, but the key is that they provide context-rich details for specific events.
In fact, logs are usually the first go-to resource when investigating an issue, because they can show the exact error or behavior at the moment it occurred.
In a microservices world, logging gets tricky because each service writes its own logs, often scattered across many machines or containers.
It’s important to centralize and aggregate logs so you can search them in one place (imagine trying to SSH into 50 servers to find an error – no thanks!).
By designing logging early, you can decide on a consistent format (e.g., structured logs with key fields) and include identifiers like trace IDs in each log.
That way, you can follow a single user’s journey across services just by filtering logs.
Good logging practices mean that when something breaks at 3 AM, you can quickly find the “Error: DB connection timeout” in your logs and know which service and operation it came from.
Metrics (Pillar 2: Numbers and Trends)
Metrics are the numbers that measure your system’s behavior over time.
If logs are like a diary, metrics are like vital signs.
They track things like how many requests per second your service handles, the latency of those requests, memory and CPU usage, error rates, and so on.
Metrics are typically numeric values recorded at intervals (e.g. “orders-service processed 120 requests in the last minute” or “CPU at 75%”).
They have a name, a timestamp, and a value – and often some tags or labels (for example, a metric requests_success_count{service=”orders”}). Metrics are structured by default and optimized for storage and querying, which makes it easy to plot them on dashboards or set up alerts.
What do metrics give you?
Trends and aggregate insights.
A single log might tell you one order failed at 3:02 PM, but a metric can show that 500 orders succeeded in that minute and 5 failed, and that the failure rate spiked from the usual 0.1% to 1%.
Metrics help answer questions like “Is my application getting slower over the past week?” or “Did our new release increase the error rate?”.
They are fantastic for monitoring the overall health of services and catching anomalies early.
However, metrics usually won’t tell you the detailed cause – they’ll raise the flag that something’s off (e.g. error rate jumped) but you’ll likely dive into logs or traces to diagnose the exact issue.
This is why metrics often go hand-in-hand with logs and traces to give full context.
Designing with metrics in mind from the start means deciding what performance indicators matter for each service.
For example, if you’re building a payment service, you might want to record metrics for transaction latency, number of payments processed, and number of payment failures.
By instrumenting your code early (using libraries or an observability SDK), you ensure that when your service goes live, you already have a dashboard of its vital signs.
It’s much easier to build this in as you code, rather than bolting it on later.
Tracing (Pillar 3: Request Journeys)
Traces are the story of a request as it travels through multiple services.
In a monolithic app, an error might be easy to track in a single log file.
In a microservice architecture, a single user request (like “Place an Order”) might trigger calls to the Auth service, Order service, Inventory service, Payment service, etc.
A distributed trace follows that request across all those services, showing how long each step took and where any breakdown occurred.
You can think of a trace like a call stack for a distributed system or a map of the request’s journey.
Traces are composed of spans, where each span represents one service’s work on the request (e.g. a span for the Order service handling the “Place Order” call, another span for the Payment service charging the credit card, and so on).
By piecing together spans, you get a timeline of the whole operation.
Why are traces so powerful?
Because they let you pinpoint where a problem happened in a complex workflow.
For example, a trace might reveal that the Order service was fast, but the Payment service took 3 seconds and timed out waiting on the database.
This insight is hard to get from metrics alone (which might only show overall latency) or from logs alone (which are siloed by service).
Tracing shines in answering questions like “Which service caused this request to slow down?” or “What’s the sequence of calls leading up to this error?”.
In fact, distributed tracing has become essential for microservices – it provides end-to-end visibility that’s otherwise nearly impossible when you have many interdependent services.
To design for tracing early, you’ll want to use a tracing framework or standard.
This usually means instrumenting each service to propagate a trace ID (a unique ID for each request) and to send trace data to a central tracing system.
It’s definitely something to plan from the beginning, because adding tracing later can be labor-intensive.
But the payoff is huge: when an issue arises, you can pull up a trace view and see the entire path of a request through your microservices, complete with timestamps for each step.
That makes troubleshooting distributed issues so much easier.
Why You Should Design Observability Early
You might be thinking, “Can’t I just add these observability things after my app is built?”
Technically you can, but it’s much harder and costlier to do it later.
In a fast-paced development environment, it’s tempting to focus on features first and worry about logs/metrics/traces when something goes wrong.
However, baking observability into your design from day one will save you a ton of pain down the road.
Early in development, you have the chance to instrument code as you write it, choose consistent logging formats, and set up the tools you need.
By doing so, you ensure that when your microservices hit production, you already have eyes on them.
The dynamic, distributed nature of microservices makes it necessary to build observability into the system by design.
Unknown issues will pop up in production, and you want to have the data to diagnose them readily available.
Designing observability early also forces you to think about what to measure and what “normal” looks like for your system.
It encourages a culture of measuring and monitoring from the start, which often leads to more reliable software.
It’s much easier to incorporate things like correlation IDs, centralized log collectors, metrics dashboards, and tracing agents while you’re architecting the system than as an afterthought.
Early observability design might involve setting up infrastructure like an ELK stack or Prometheus+Grafana, or using cloud monitoring services, and ensuring each microservice is hooked in.
This upfront investment pays off by shortening your debug cycles and reducing downtime when incidents occur.
Finally, remember that the three pillars work best together. Just logging or just metrics alone won’t give you true observability.
For example, your metrics might alert you to a spike in errors, traces can point you to which service in the chain is the culprit, and logs from that service can reveal the exact exception that was thrown.
By integrating logs, metrics, and traces, you get a 360° view that makes problem solving dramatically easier.
Many modern observability tools and platforms bring all three together in one place for this very reason.
FAQs
Q: What are the three pillars of observability?
The three pillars of observability are logs, metrics, and traces. Logs are the records of events (e.g. errors, transactions) with context like timestamps. Metrics are the numeric measurements of system performance over time (e.g. CPU usage, request rates). Traces capture the path of a request through a system, helping to identify where bottlenecks or failures occur. Together, these pillars offer insight into a system’s health from different angles.
Q: Why is observability important for microservices?
Observability is crucial for microservices because it’s very difficult to troubleshoot a distributed application using traditional methods. In a microservices architecture, a single user action might involve many services. Observability (through logs, metrics, and traces) lets you pinpoint issues across these services quickly. It helps reduce downtime by allowing teams to find root causes faster, ensures each service’s performance is transparent, and ultimately makes a complex system much easier to manage and debug.
Q: What is distributed tracing in microservices?
Distributed tracing is a technique to follow a single user request as it flows through multiple microservices. It links together the actions of each service (spans) under a common trace ID. For example, when an API call touches Service A, then Service B, then a database, the trace records the timeline and outcome of each step. This end-to-end view helps developers see where delays or errors happened in the chain of calls, which is essential for diagnosing issues in microservices where many components are involved in handling one request.