
How to Design Google Maps in 45 Mins: A Complete System Design Interview Walkthrough
What happens when you pinch to zoom, search for 'coffee near me,' or tap 'Start navigation.' Three core flows traced step by step through CDN, Elasticsearch, and an in-memory road graph.


What This Guide Covers
A step-by-step system design answer for Google Maps, following the exact format interviewers expect
14 sections from requirements to bottlenecks, with concrete numbers, APIs, data models, and architecture
Detailed end-to-end flows for searching a location, loading map tiles, and computing navigation routes
Scaling strategies for serving billions of map tile requests per day
1. Restate the Problem and Pick the Scope
Google Maps is a location platform that lets users view maps, search for places, get directions, and navigate in real time. The system serves billions of map tile requests daily, handles millions of navigation sessions simultaneously, and maintains a constantly updating database of roads, businesses, and traffic conditions.
The main user groups are everyday users (searching for places, getting driving/walking/transit directions, navigating in real time) and business owners (managing their business listing, responding to reviews).
For this design, I will focus on three core features: rendering interactive maps (pan, zoom, tile loading), searching for places by name or category, and computing turn-by-turn navigation with real-time traffic. I will not cover Street View, indoor maps, satellite imagery, offline maps, or the business listing management side.
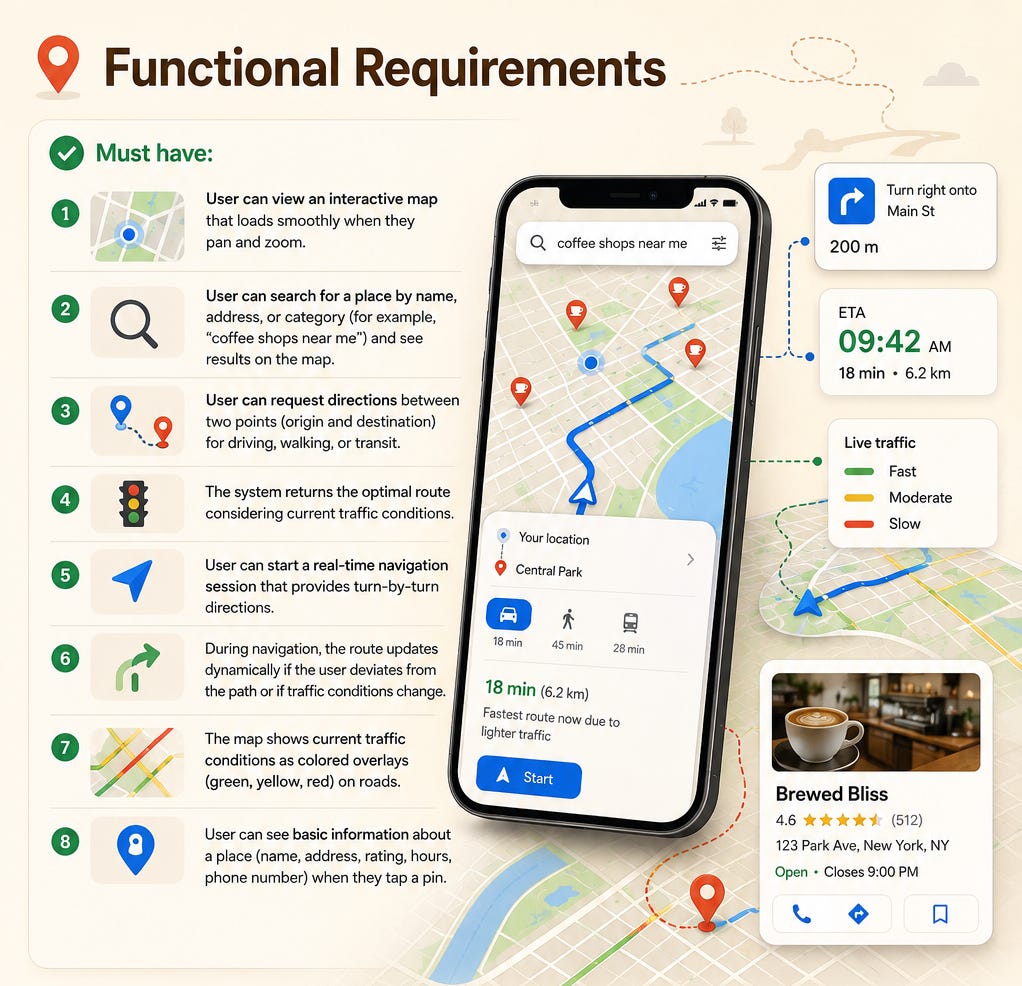
2. Clarify Functional Requirements
Must have:
User can view an interactive map that loads smoothly when they pan and zoom.
User can search for a place by name, address, or category (for example, “coffee shops near me”) and see results on the map.
User can request directions between two points (origin and destination) for driving, walking, or transit.
The system returns the optimal route considering current traffic conditions.
User can start a real-time navigation session that provides turn-by-turn directions.
During navigation, the route updates dynamically if the user deviates from the path or if traffic conditions change.
The map shows current traffic conditions as colored overlays (green, yellow, red) on roads.
User can see basic information about a place (name, address, rating, hours, phone number) when they tap a pin.
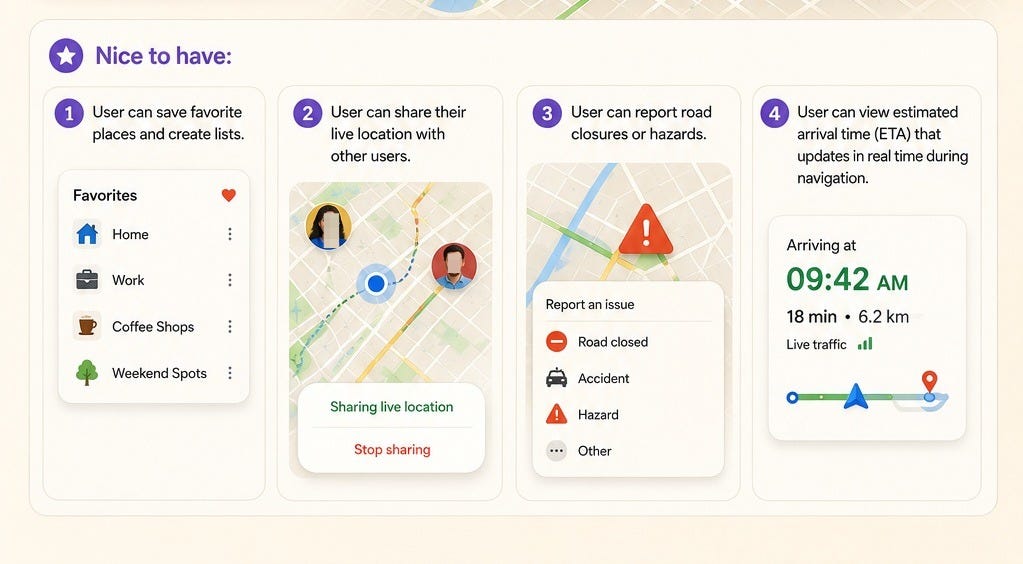
Nice to have:
User can save favorite places and create lists.
User can share their live location with other users.
User can report road closures or hazards.
User can view estimated arrival time (ETA) that updates in real time during navigation.
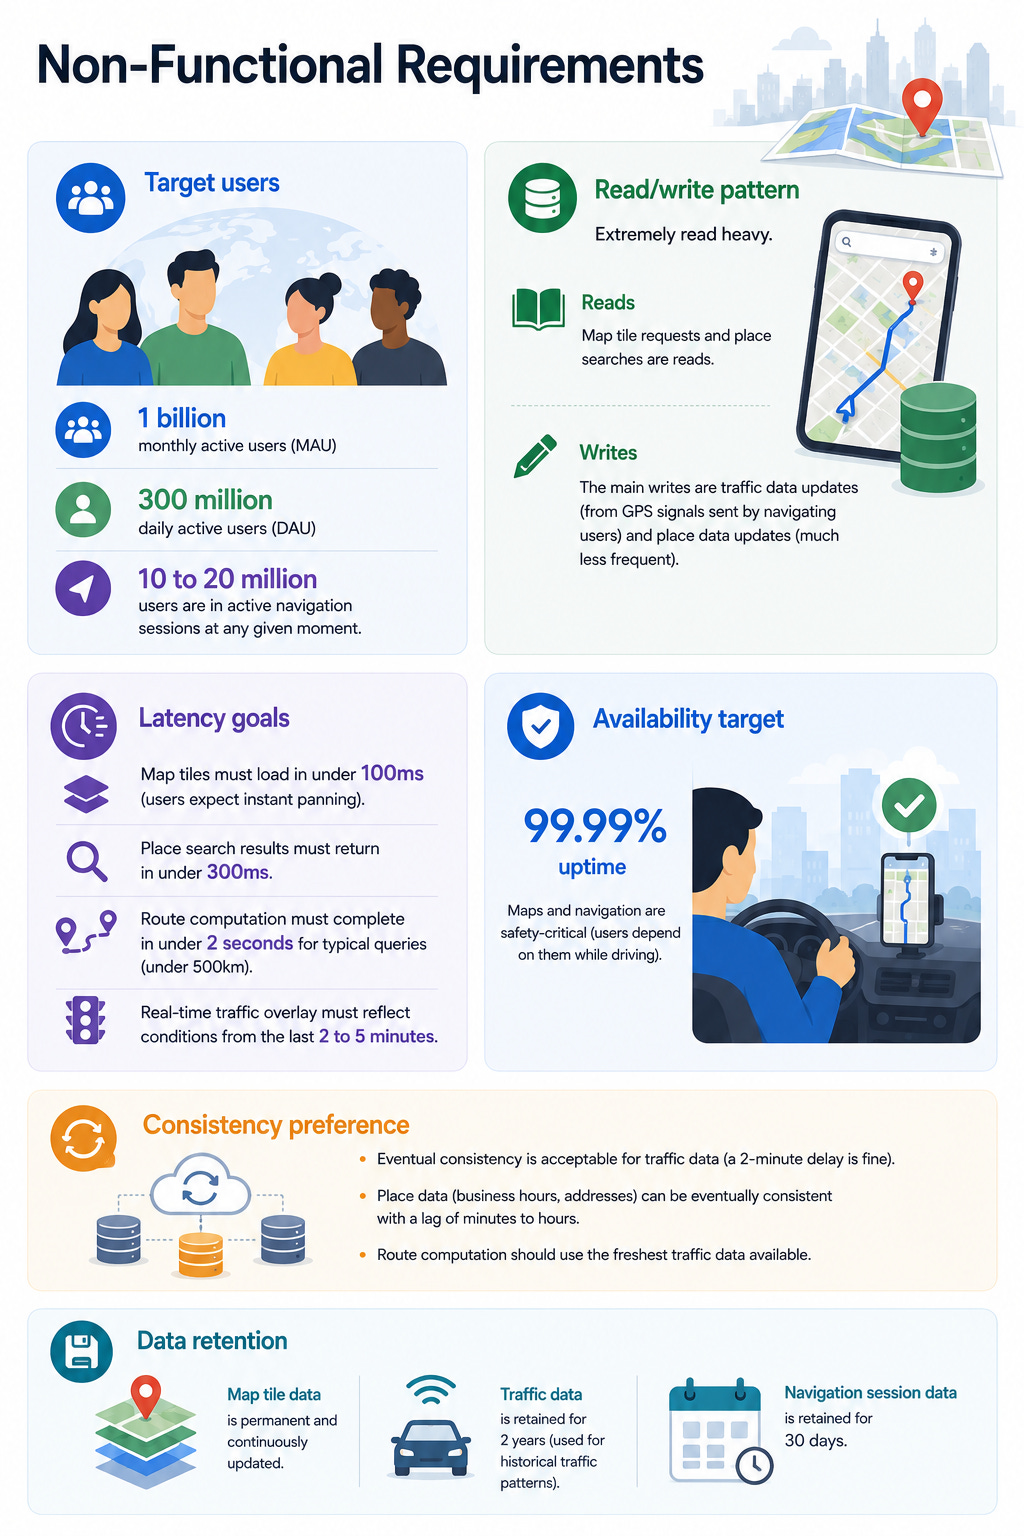
3. Clarify Non-Functional Requirements
Target users: 1 billion monthly active users (MAU), 300 million daily active users (DAU). At any given moment, 10 to 20 million users are in active navigation sessions.
Read/write pattern: Extremely read heavy. Map tile requests and place searches are reads. The main writes are traffic data updates (from GPS signals sent by navigating users) and place data updates (much less frequent).
Latency goals: Map tiles must load in under 100ms (users expect instant panning). Place search results must return in under 300ms. Route computation must complete in under 2 seconds for typical queries (under 500km). Real-time traffic overlay must reflect conditions from the last 2 to 5 minutes.
Availability target: 99.99% uptime. Maps and navigation are safety-critical (users depend on them while driving).
Consistency preference: Eventual consistency is acceptable for traffic data (a 2-minute delay is fine). Place data (business hours, addresses) can be eventually consistent with a lag of minutes to hours. Route computation should use the freshest traffic data available.
Data retention: Map tile data is permanent and continuously updated. Traffic data is retained for 2 years (used for historical traffic patterns). Navigation session data is retained for 30 days.
4. Back-of-the-Envelope Estimates
Map tile requests:
300 million DAU. Average user opens the map 3 times per day. Each map view loads roughly 20 tiles (a 5x4 grid at the current zoom level).
Tile requests per day = 300M x 3 x 20 = 18 billion tiles/day.
Tiles per second (average) = 18B / 86,400 = ~208,000 tiles/second.
Peak = 3x average = ~625,000 tiles/second.
Most tiles are served from CDN cache (hit rate 95%+), so the origin serves ~31,000 tiles/second at peak.
Place search requests:
Assume 50% of sessions include a search. 300M x 3 x 0.5 = 450 million searches/day.
Searches per second = 450M / 86,400 = ~5,200 QPS average, ~15,600 QPS peak.
Route computation requests:
Assume 10% of sessions request a route. 300M x 3 x 0.1 = 90 million routes/day.
Routes per second = 90M / 86,400 = ~1,040 QPS average, ~3,100 QPS peak.
Route computation is CPU-intensive. At 200ms per route, each server handles 5 routes/second. We need ~620 routing servers at peak.
Traffic data ingestion:
15 million active navigation sessions at peak. Each sends a GPS update every 5 seconds.
GPS updates per second = 15M / 5 = 3 million GPS events/second.
Each event is ~100 bytes (lat, lng, speed, heading, timestamp, road_segment_id).
Ingestion bandwidth = 3M x 100 bytes = 300 MB/second.
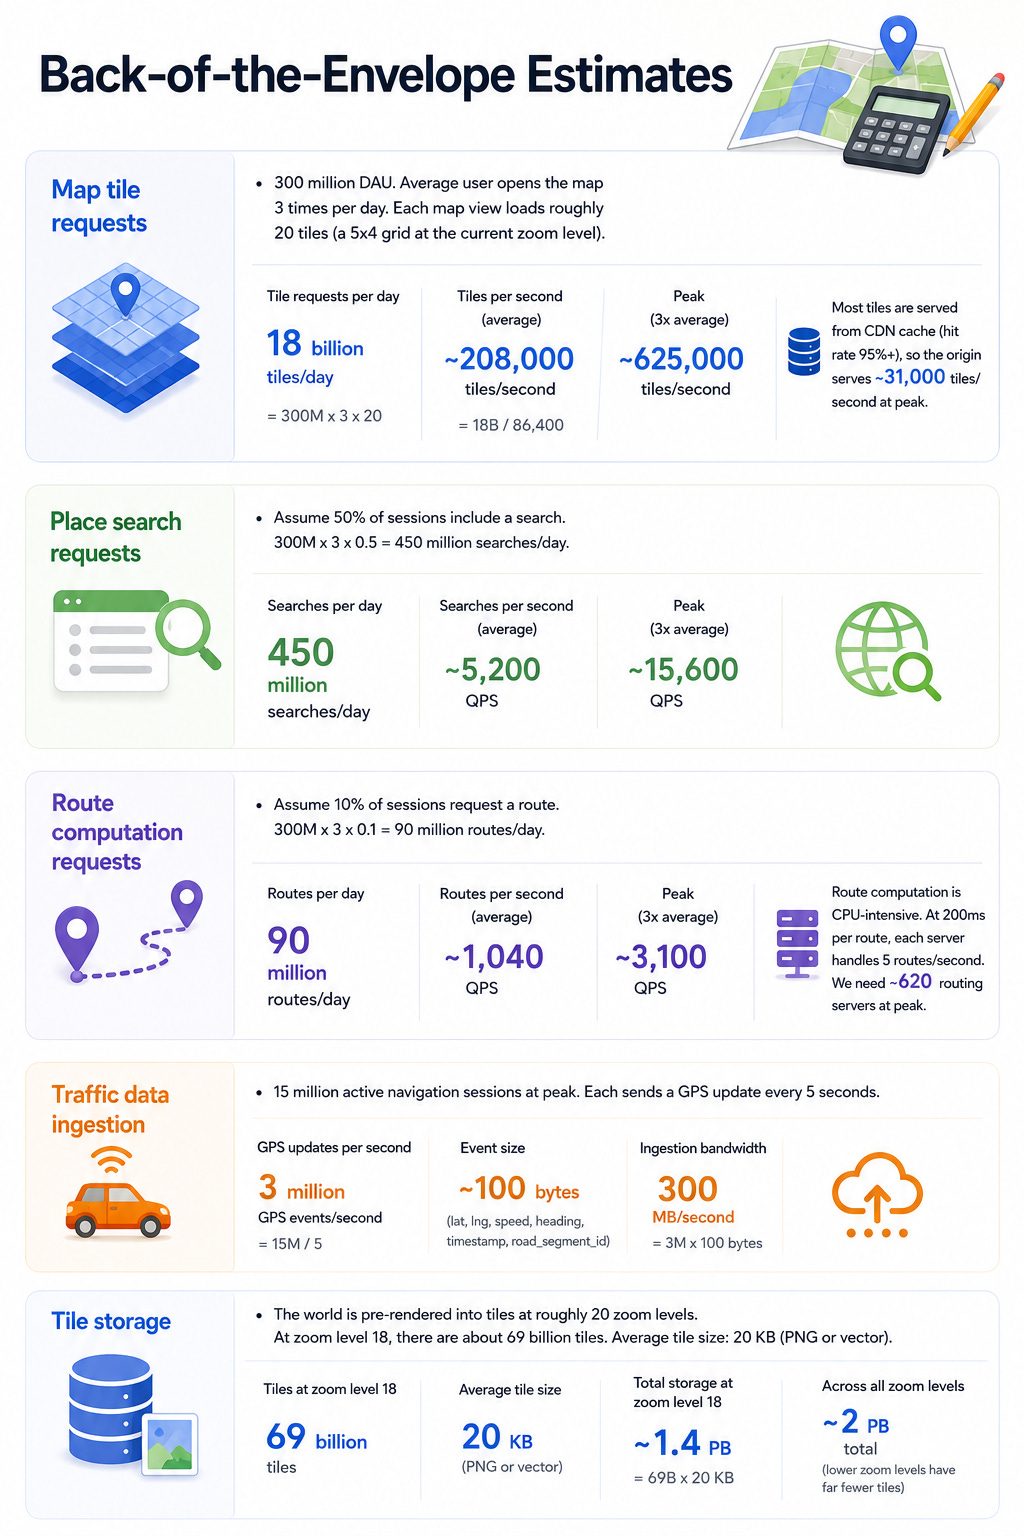
Tile storage:
The world is pre-rendered into tiles at roughly 20 zoom levels. At zoom level 18, there are about 69 billion tiles. Average tile size: 20 KB (PNG or vector).
Total tile storage = 69B x 20 KB = ~1.4 PB for one zoom level. Across all zoom levels, roughly 2 PB total (lower zoom levels have far fewer tiles).
5. API Design
Map Tile API
Load a map tile:
GET /api/v1/tiles/{zoom}/{x}/{y}.png
Headers: Accept-Encoding: gzip
Response 200: binary PNG or vector tile (PBF format)
Response 304: Not Modified (if client sends If-None-Match with cached ETag)
Response 404: Tile does not exist at this coordinate
Tiles are identified by three coordinates: zoom level (0 to 20), x (column), and y (row). This follows the standard “slippy map” tile scheme. The client calculates which tiles are visible based on the viewport and zoom level, then requests them in parallel.
Place Search API
Search for places:
GET /api/v1/places/search?query=coffee+shops&lat=37.7749&lng=-122.4194&radius=5000&limit=20
Headers: Authorization: Bearer <token>
Response 200: {
  "results": [
    {
      "place_id": "pl_abc123",
      "name": "Blue Bottle Coffee",
      "address": "66 Mint St, San Francisco, CA",
      "lat": 37.7821,
      "lng": -122.4056,
      "rating": 4.5,
      "category": "coffee_shop",
      "is_open": true,
      "distance_meters": 850
    }
  ],
  "next_cursor": "..."
}
Errors: 400 (invalid coordinates), 429 (rate limited)
Route Computation API
Get directions:
POST /api/v1/routes
Headers: Authorization: Bearer <token>
Body: {
  "origin": { "lat": 37.7749, "lng": -122.4194 },
  "destination": { "lat": 37.3861, "lng": -122.0839 },
  "mode": "driving",
  "departure_time": "2026-05-13T08:00:00Z",
  "avoid": ["tolls"]
}
Response 200: {
  "routes": [
    {
      "route_id": "rt_xyz",
      "distance_meters": 56300,
      "duration_seconds": 2820,
      "duration_in_traffic_seconds": 3450,
      "polyline": "encoded_polyline_string",
      "steps": [
        {
          "instruction": "Head north on Market St",
          "distance_meters": 400,
          "duration_seconds": 60,
          "start_lat": 37.7749,
          "start_lng": -122.4194
        }
      ],
      "traffic_summary": "moderate"
    }
  ]
}
Errors: 400 (invalid coordinates), 404 (no route found), 429 (rate limited)
Real-Time Navigation
Start navigation session (WebSocket):
ws://navigation.maps-example.com/ws?route_id=rt_xyz&token=<auth>
Client sends GPS updates upstream:
{ "type": "location_update", "lat": 37.7812, "lng": -122.4100, "speed_kmh": 45, "heading": 350, "timestamp": "..." }
Server pushes events downstream:
{ "type": "next_instruction", "instruction": "In 200 meters, turn right on 3rd St", "distance_meters": 200 }
{ "type": "reroute", "reason": "traffic_ahead", "new_route": { ... } }
{ "type": "eta_update", "eta_seconds": 1820 }
{ "type": "traffic_update", "segment_id": "seg_123", "speed_kmh": 15, "color": "red" }
6. High-Level Architecture
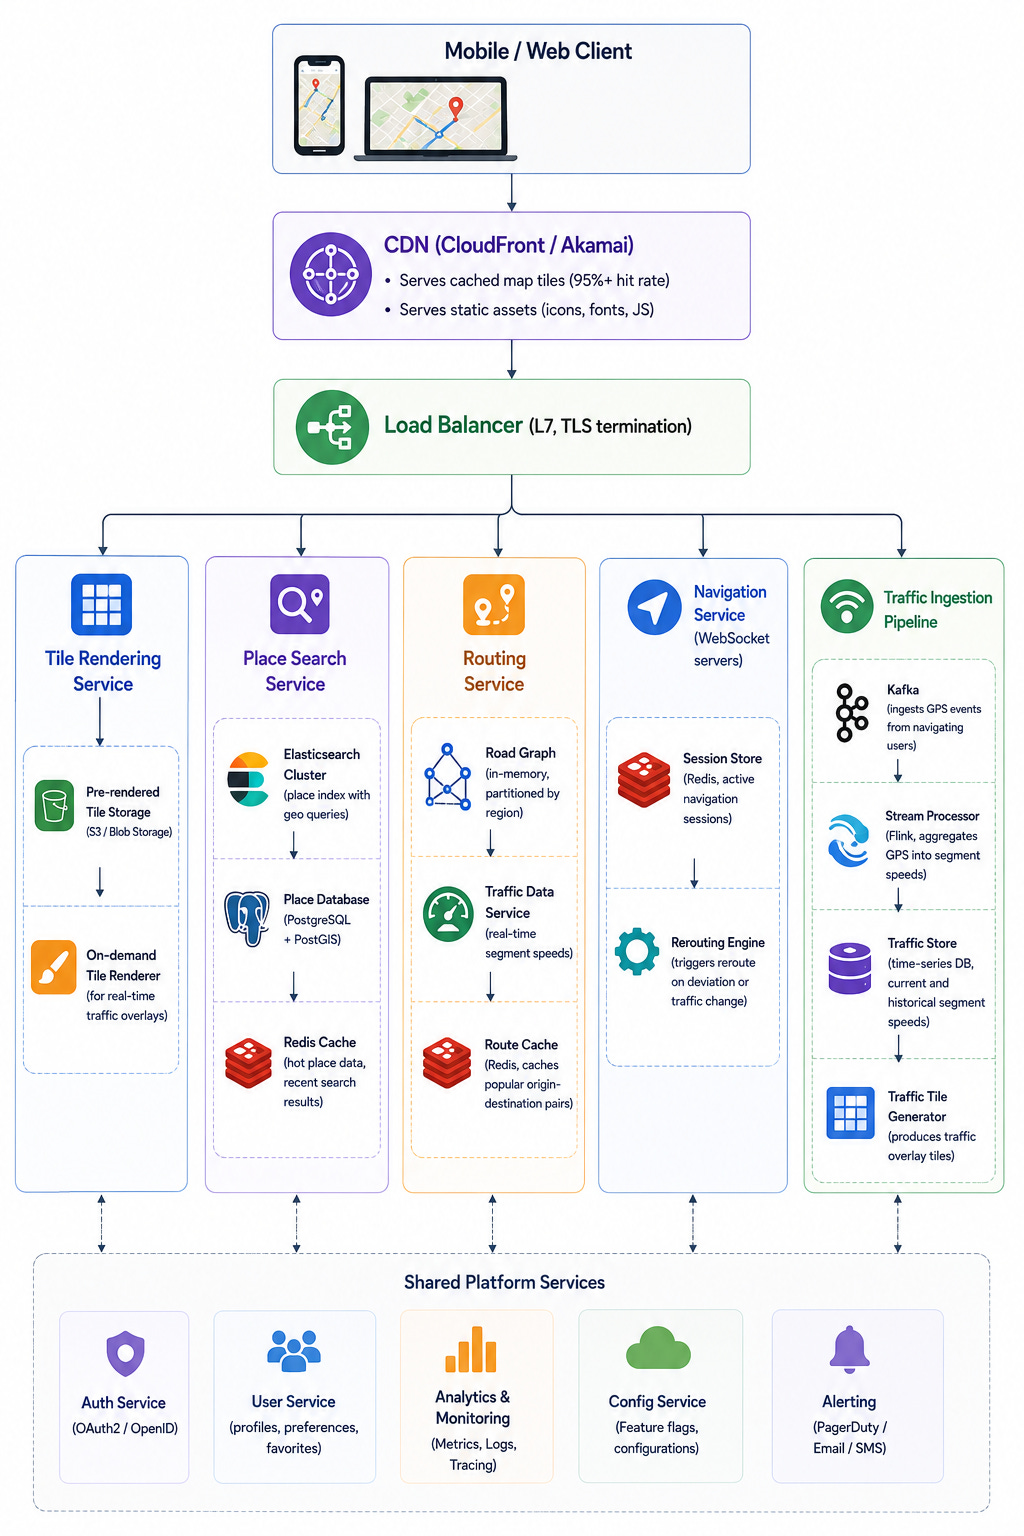
CDN: The most critical performance component. Serves 95%+ of map tile requests from edge cache. Tiles are static images or vector data that change infrequently (base map tiles are regenerated weekly). Traffic overlay tiles are cached with short TTLs (2 minutes).
Tile Rendering Service: Serves tile requests that miss the CDN. Pre-rendered base tiles are stored in object storage (S3). Traffic overlay tiles are rendered on demand by combining base tile data with real-time traffic segment colors.
Keep reading with a 7-day free trial
Subscribe to System Design Nuggets to keep reading this post and get 7 days of free access to the full post archives.