
How to Create Diagrams in System Design Interview
Avoid common diagramming mistakes. A step-by-step guide on how to use standard shapes and layouts to create professional technical diagrams that communicate clearly in the system design interview.


The complexity of modern software engineering has outpaced the ability of any single human mind to fully grasp a system solely through code.
When an application consists of hundreds of microservices, distributed databases, and third-party integrations, the source code acts as a fragmented puzzle rather than a cohesive picture.
Engineers often struggle to understand how a request travels through these tangled webs of infrastructure.
This lack of clarity leads to architectural flaws, communication breakdowns between teams, and critical failures in production.
System design diagrams serve as the solution to this complexity. They are not merely supplemental drawings. They are rigorous technical specifications that define the structure and behavior of a system.
A well-constructed diagram exposes bottlenecks that are invisible in the code. It highlights single points of failure. It aligns frontend and backend developers on the exact data payload and protocol required for a feature to work.
Mastering the skill of creating these diagrams is essential for any developer aiming to move into senior or architectural roles. It requires a shift in thinking from the syntax of programming languages to the topology of distributed systems.
This guide explores the fundamental principles of technical diagramming. It focuses on how to construct clear, accurate, and scalable representations of software architecture.
The Goal of Visual Communication
The primary purpose of a system design diagram is to transfer a mental model from one person’s brain to another with zero ambiguity.
When you draw a box on a whiteboard or a digital canvas, you are making a specific technical assertion. You are stating that a component exists.
You are stating that it has a specific responsibility. You are stating that it interacts with other components in a defined way.
Many beginners mistake diagrams for rough sketches.
They draw unlabeled boxes and connect them with vague lines. This creates confusion.
A diagram must be precise. It should answer questions rather than create them.
If a viewer has to ask what a box does or which direction the data is flowing, the diagram has failed.
To achieve this precision, you must understand the two main categories of diagrams used in system design. These are High-Level Design (HLD) and Low-Level Design (LLD).
High-Level Design (HLD)
This type of diagram focuses on the macro view. It depicts the entire system as a collection of major components. It shows how the user connects to the load balancer. It shows how the application servers connect to the database. It shows how the system interacts with external services.
The goal is to illustrate the flow of data across the network. It does not concern itself with class names, function parameters, or internal algorithms.
Low-Level Design (LLD)
This type of diagram zooms in on a specific component.
If the HLD shows a “Payment Service” box, the LLD opens up that box to show the internal logic. It might depict the specific interface definitions.
It might show the database schema. It might show the sequence of events during a transaction. It connects the architectural concept to the actual implementation.
The Standard Vocabulary of Shapes
While there are academic standards like UML (Unified Modeling Language), modern software engineering teams typically use a simplified set of shapes.
Using these standard shapes allows anyone to read your diagram without needing a legend.
The Compute Node (Rectangle)
The rectangle is the most common shape. It represents a unit of computation or logic. This is where your code runs. It processes data but usually does not store it permanently.
Web Server: Handles incoming HTTP requests.
Worker Service: Processes background tasks.
Microservice: A specific domain logic component.
Always label the rectangle with its specific role.
A blank rectangle conveys no information. A rectangle labeled “Server” is too vague.
A rectangle labeled “Order Processing Service” is perfect. It tells the viewer exactly what logic is contained within that boundary.
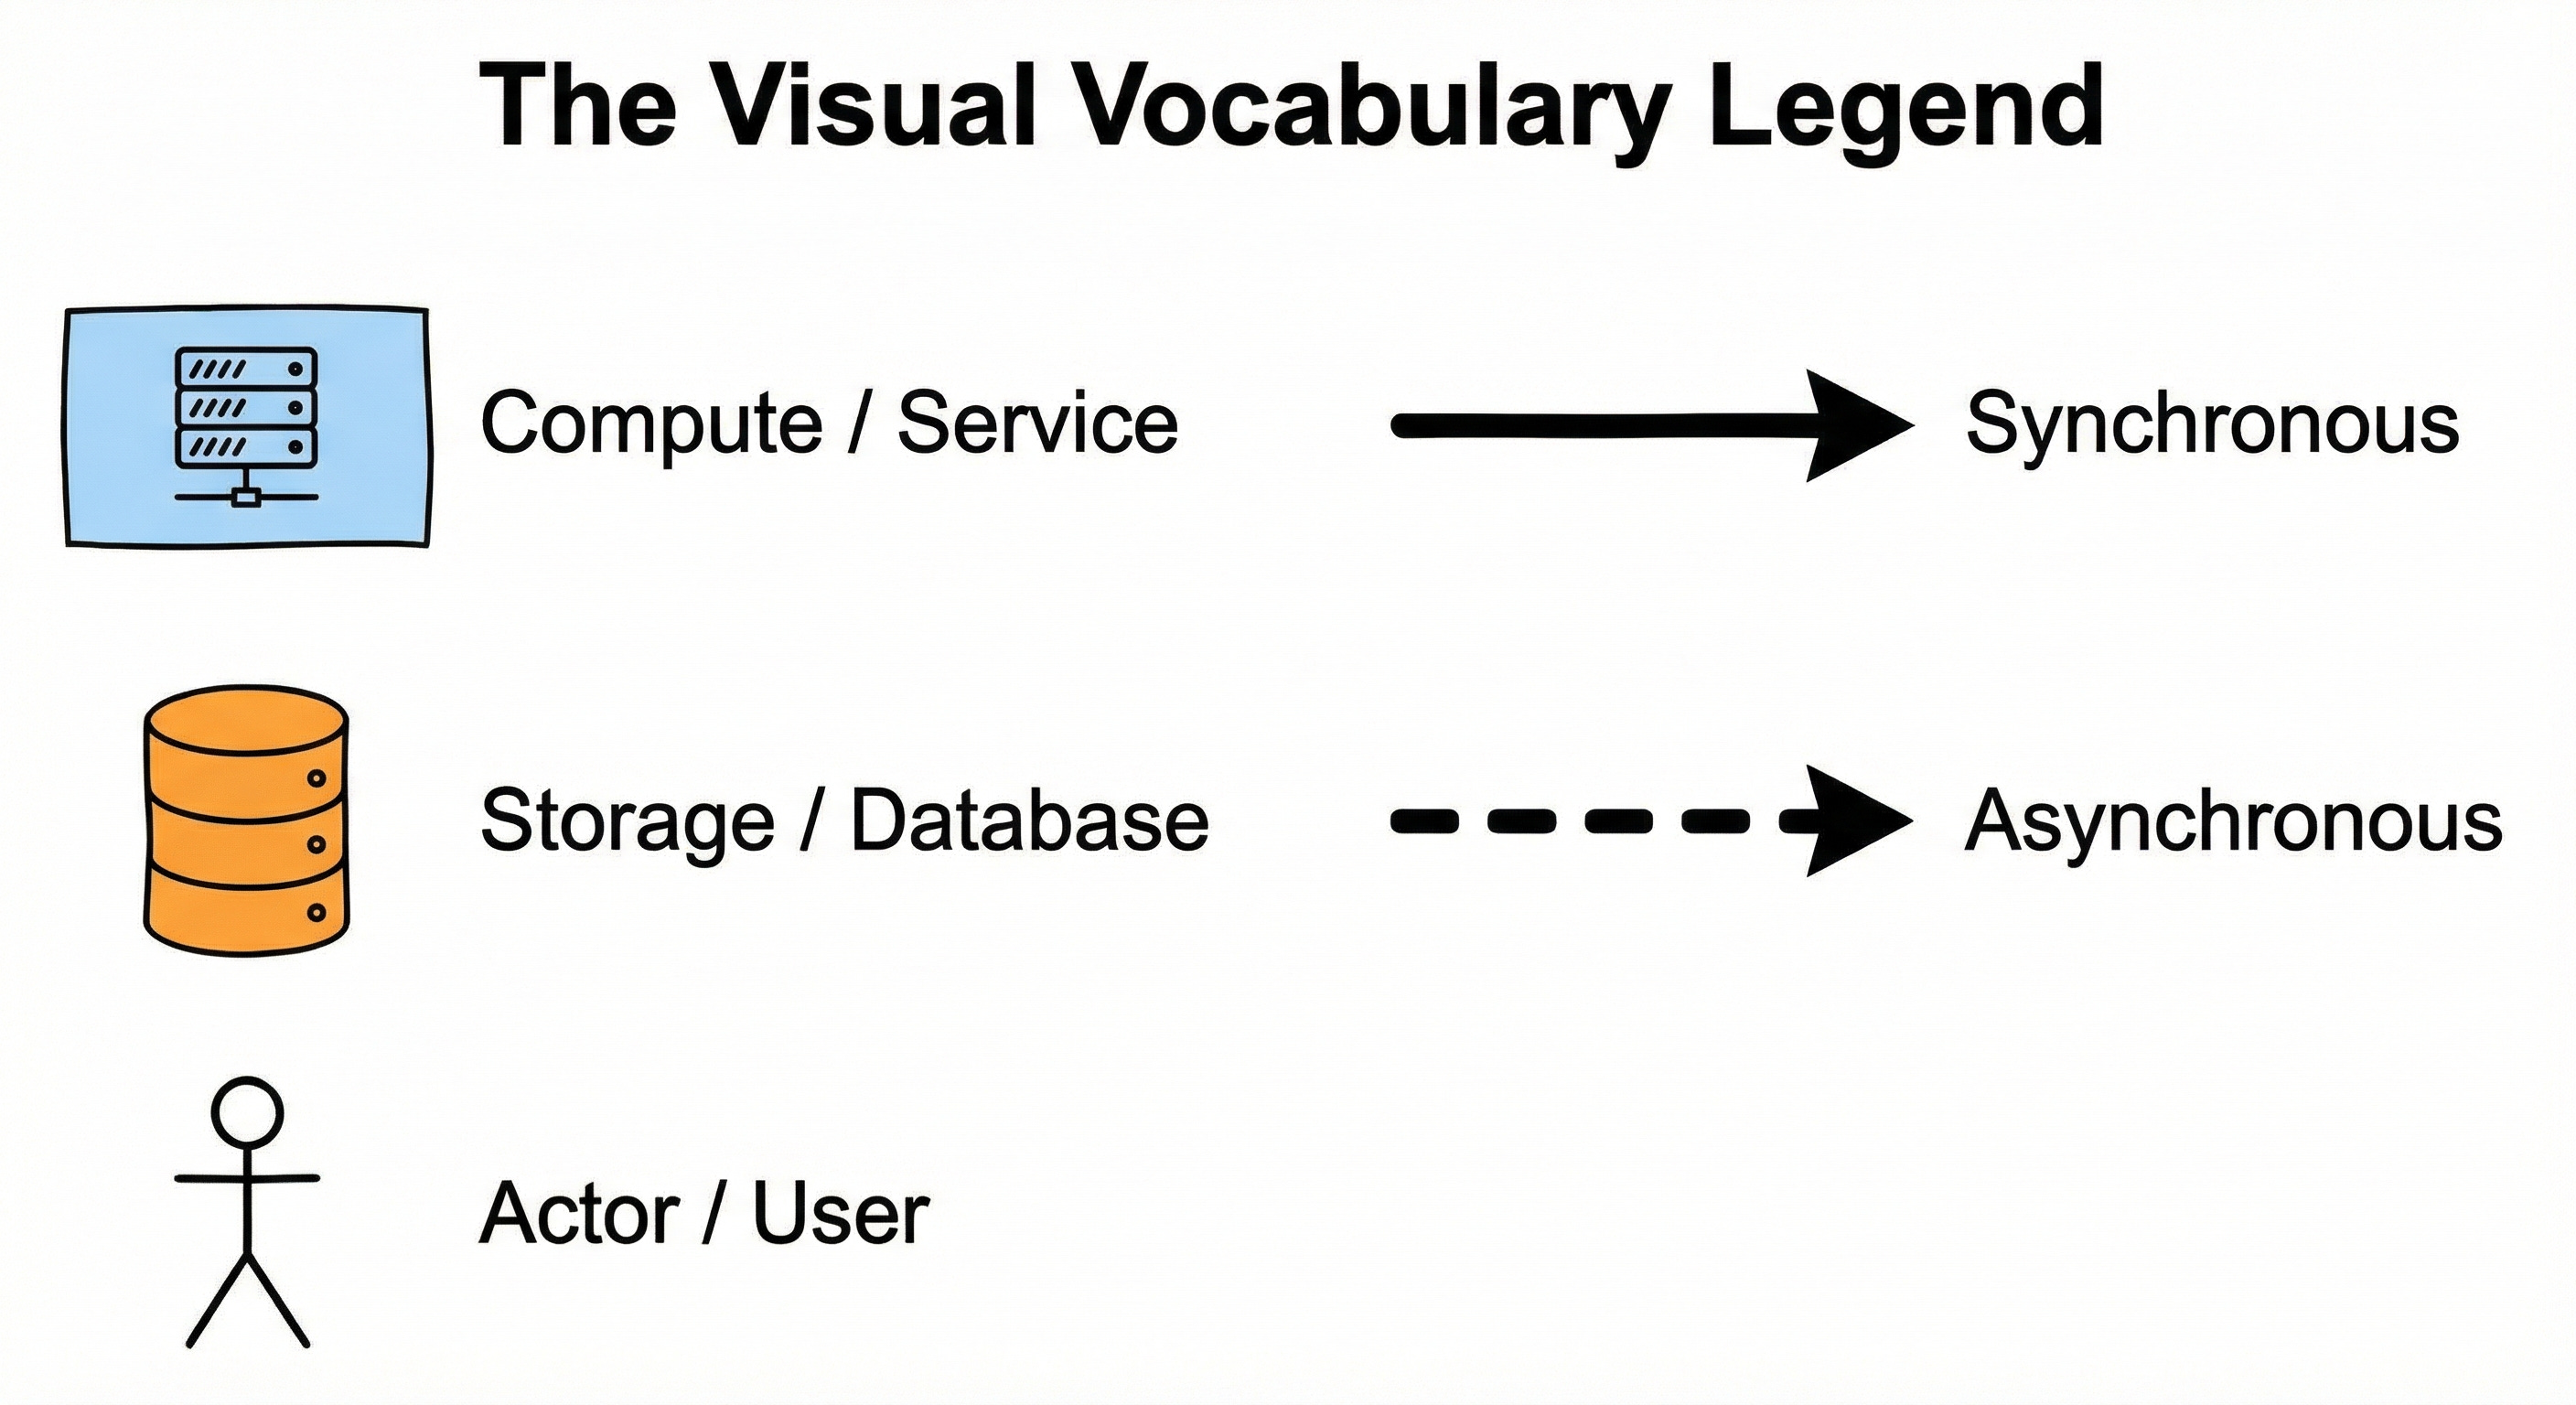
The Storage Node (Cylinder)
The cylinder universally represents data persistence. It indicates that state is being saved to a disk. This visual distinction is critical. It separates the stateless processing units from the stateful storage units.
SQL Database: For structured, relational data.
NoSQL Database: For unstructured or document data.
Cache: For temporary, high-speed data storage.
When you draw a cylinder, you must also label the technology.
Writing “Database” is not enough.
Writing “PostgreSQL” or “Redis” tells the viewer about the consistency and durability guarantees of that component.
Learn more about SQL vs NoSQL.
Keep reading with a 7-day free trial
Subscribe to System Design Nuggets to keep reading this post and get 7 days of free access to the full post archives.