
20 System Design Diagrams Every Software Engineer Should Memorize
Most candidates draw the same vague boxes-and-arrows diagram for every question. These 20 specific diagrams cover cache-aside flows, sharding, circuit breakers, WebSocket delivery, & 16 more patterns.


What This Guide Covers
20 architecture diagrams that appear repeatedly in system design interviews and production engineering
Each diagram explained clearly: what it shows, when to draw it, and the one insight it communicates
Organized into 5 categories: core architecture, data flow, scaling, reliability, and communication
How to draw each one from memory in under 60 seconds
System design interviews are visual. You draw while you talk.
The diagram is not decoration. It is the primary artifact the interviewer evaluates.
A clear diagram communicates more in 30 seconds than 5 minutes of verbal explanation.
But most candidates draw the same vague diagram every time: a cloud labeled “client,” a box labeled “server,” a cylinder labeled “database,” and arrows between them. This tells the interviewer nothing about how you think.
Strong candidates draw specific diagrams for specific situations.
When the interviewer asks about caching, they draw the cache-aside flow.
When asked about scaling, they draw the sharded database with consistent hashing.
When asked about real-time delivery, they draw the WebSocket fan-out architecture.
This guide covers 20 diagrams that, together, handle any system design question you will encounter. Memorize the shape and the key labels.
In an interview, you should be able to draw any of these from memory in under 60 seconds.
Category 1: Core Architecture Diagrams
Diagram 1: The Universal Web Architecture
This is the one diagram that applies to 80% of system design questions. It is the skeleton you draw first, then customize.
This is the foundational layout of almost every modern web system. It shows the path a request takes from the user's device all the way to the database, with a few smart shortcuts in between.
The diagram captures the basic pieces every web application needs: clients, load balancers, application servers, caches, databases, and a CDN.
Think of it as the blueprint that almost every other system design diagram builds on top of.
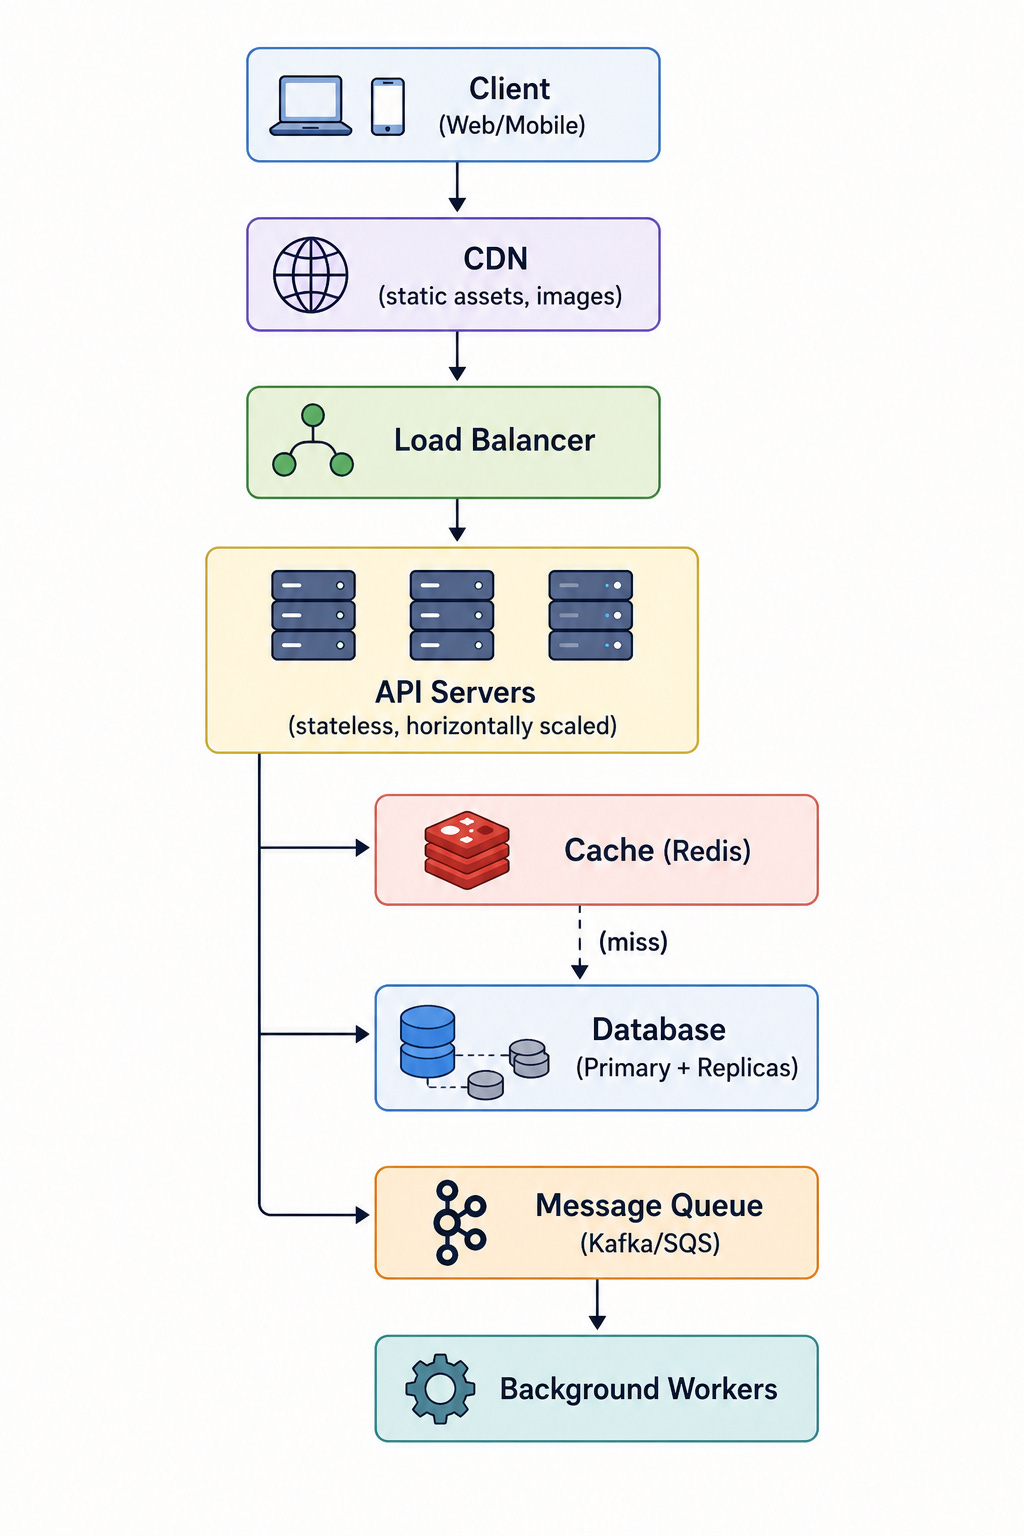
When to draw it: At the start of every system design answer. This is your opening move. Draw it in the first 5 minutes, then customize it for the specific question.
The key insight: Every web system is a pipeline from client to storage.
The CDN short-circuits the pipeline for static content.
The cache short-circuits it for hot data.
The message queue offloads heavy work from the synchronous path. Knowing where to shortcircuit is what system design is about.
Diagram 2: The Three-Tier Architecture
This diagram splits an application into three clean layers: the presentation layer (what users see), the application layer (where the logic happens), and the data layer (where information is stored).
Each layer has its own job and does not get tangled up with the others.
This separation makes the system easier to build, test, and scale. It is one of the oldest and most reliable shapes in software design.
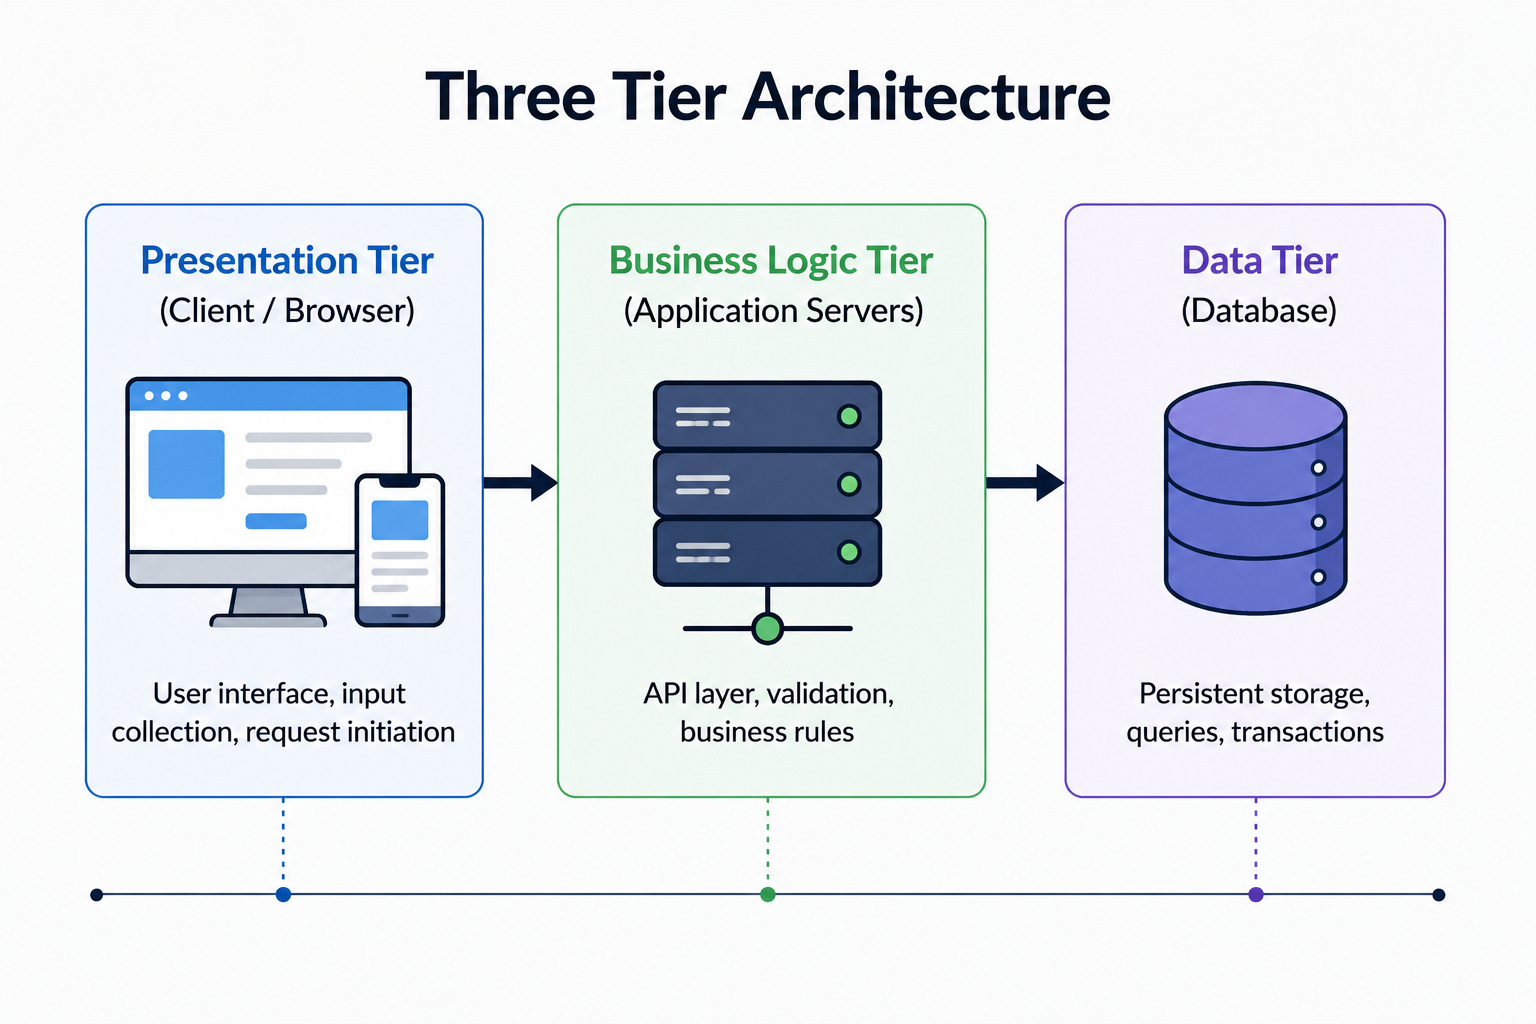
When to draw it: When discussing separation of concerns, deployment boundaries, or scaling individual tiers independently.
The key insight: Each tier scales independently.
If reads are the bottleneck, add database replicas.
If computation is the bottleneck, add application servers.
If rendering is the bottleneck, use a CDN or client-side rendering.
Diagram 3: The Microservices Architecture
This diagram shows a system built as a collection of small, independent services instead of one large application.
Each service handles a specific part of the business, like users, payments, or orders, and owns its own database.
The services talk to each other through APIs or events. This style is popular at large companies but comes with real complexity costs.
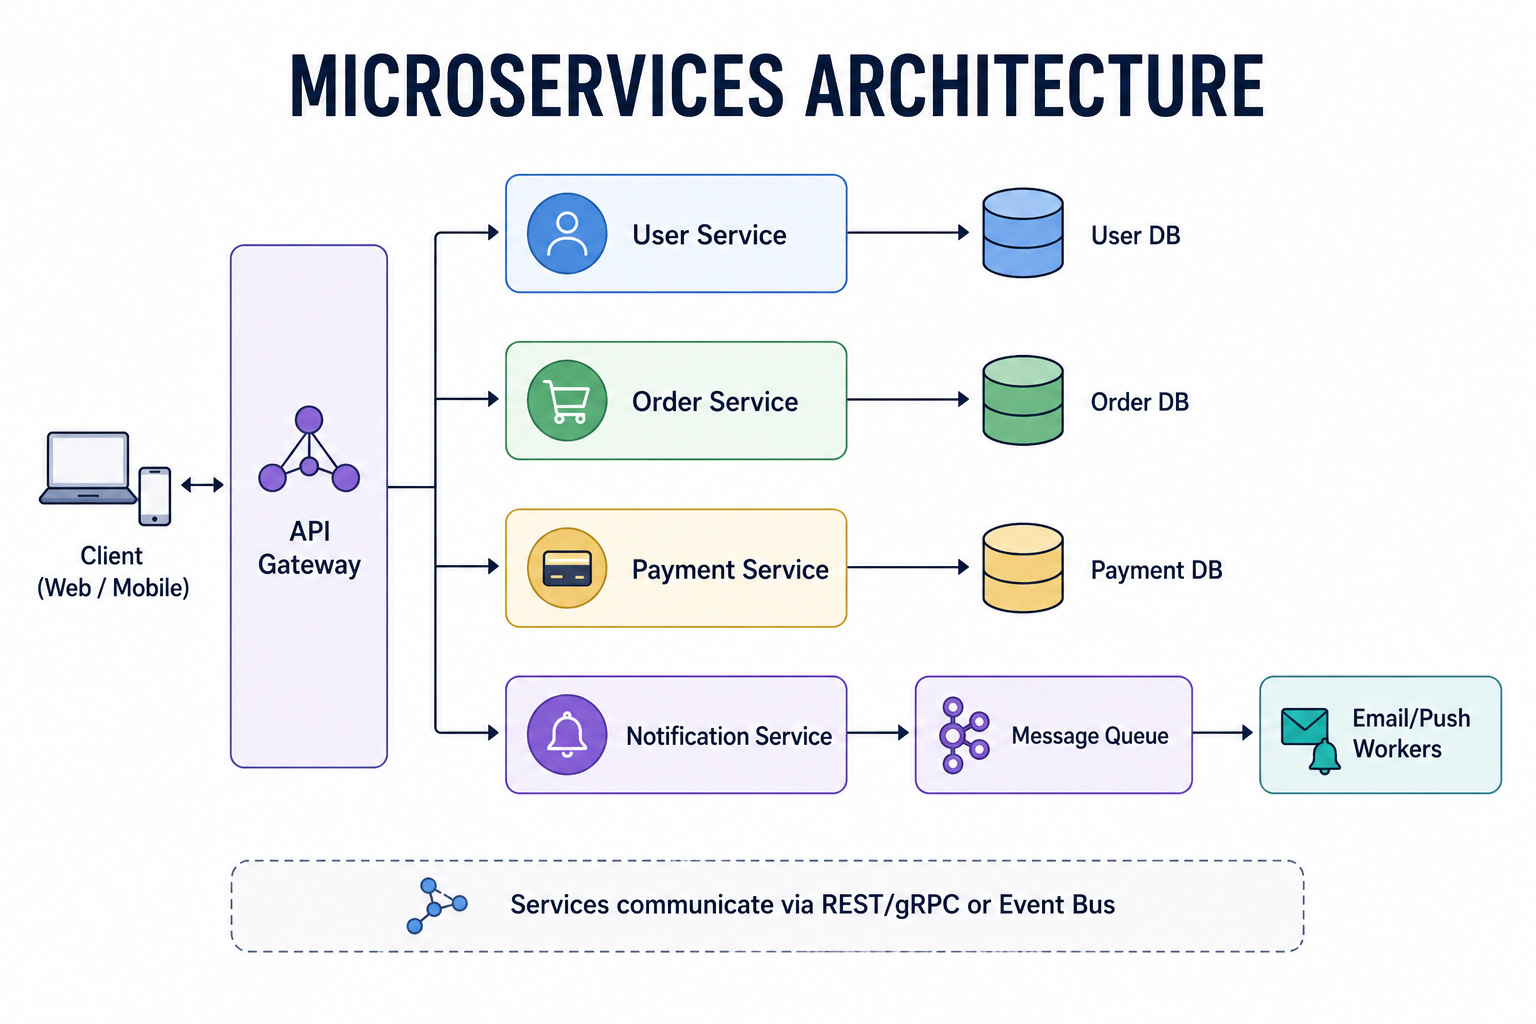
When to draw it: When the system has multiple distinct domains (users, orders, payments), the team is large enough to own separate services, or different components need independent scaling.
The key insight: Each service owns its data.
There is no shared database.
Services communicate through APIs or events. This is the opposite of a monolith, where all components share a single database.
The cost: distributed transactions, network latency between services, and operational complexity.
Keep reading with a 7-day free trial
Subscribe to System Design Nuggets to keep reading this post and get 7 days of free access to the full post archives.